Zip Codes with the Highest Percentage of Population with a Degree in Liberal Arts and History in Chantilly, VA
RELATED REPORTS & OPTIONS
Liberal Arts and History
Chantilly
Compare Zip Codes
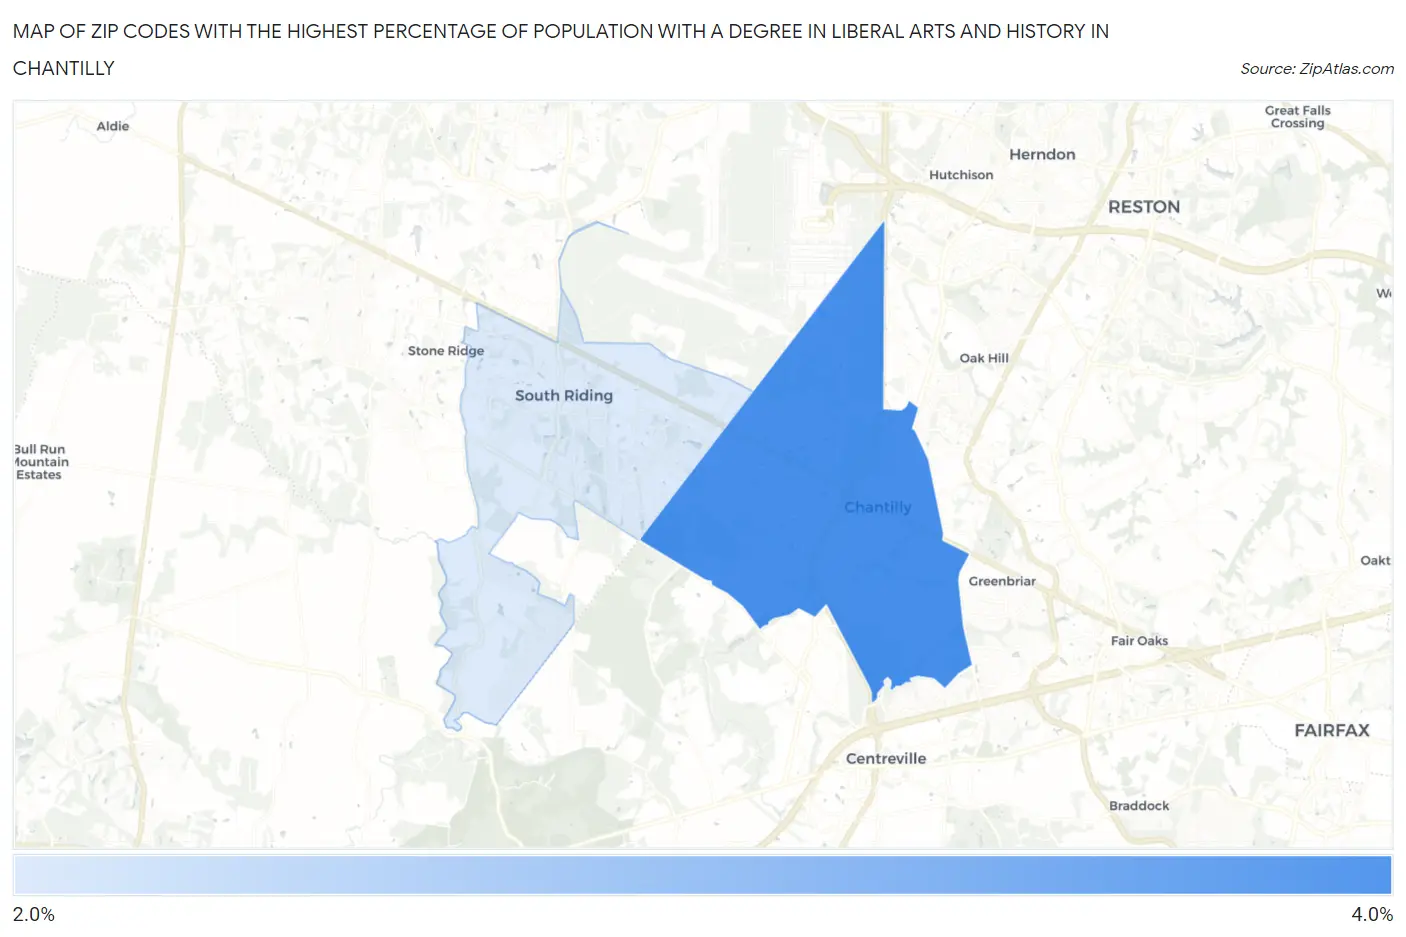
Map of Zip Codes with the Highest Percentage of Population with a Degree in Liberal Arts and History in Chantilly
0.0%
4.0%
Zip Codes with the Highest Percentage of Population with a Degree in Liberal Arts and History in Chantilly, VA
| Zip Code | % Graduates | vs State | vs National | |
| 1. | 20151 | 3.3% | 5.9%(-2.58)#546 | 4.9%(-1.60)#17,412 |
| 2. | 20152 | 2.9% | 5.9%(-2.96)#569 | 4.9%(-1.98)#18,719 |
1
Common Questions
What are the Top Zip Codes with the Highest Percentage of Population with a Degree in Liberal Arts and History in Chantilly, VA?
Top Zip Codes with the Highest Percentage of Population with a Degree in Liberal Arts and History in Chantilly, VA are:
What zip code has the Highest Percentage of Population with a Degree in Liberal Arts and History in Chantilly, VA?
20151 has the Highest Percentage of Population with a Degree in Liberal Arts and History in Chantilly, VA with 3.3%.
What is the Percentage of Population with a Degree in Liberal Arts and History in Chantilly, VA?
Percentage of Population with a Degree in Liberal Arts and History in Chantilly is 3.0%.
What is the Percentage of Population with a Degree in Liberal Arts and History in Virginia?
Percentage of Population with a Degree in Liberal Arts and History in Virginia is 5.9%.
What is the Percentage of Population with a Degree in Liberal Arts and History in the United States?
Percentage of Population with a Degree in Liberal Arts and History in the United States is 4.9%.