Zip Codes with the Highest Percentage of Population Employed in Installation, Maintenance & Repair in Chantilly, VA
RELATED REPORTS & OPTIONS
Installation, Maintenance & Repair
Chantilly
Compare Zip Codes
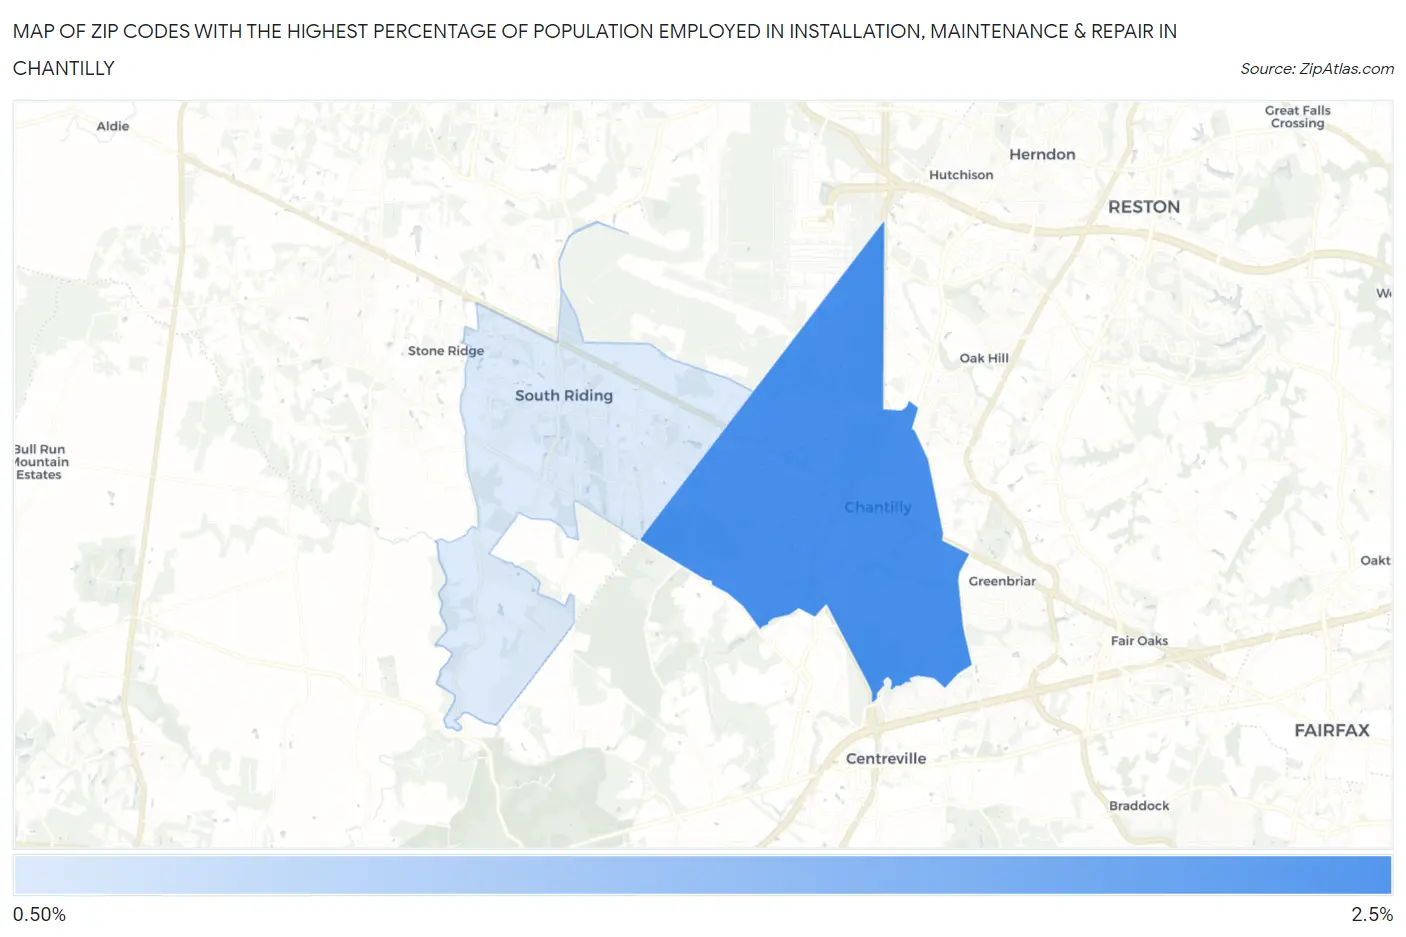
Map of Zip Codes with the Highest Percentage of Population Employed in Installation, Maintenance & Repair in Chantilly
0.0%
2.5%
Zip Codes with the Highest Percentage of Population Employed in Installation, Maintenance & Repair in Chantilly, VA
| Zip Code | % Employed | vs State | vs National | |
| 1. | 20151 | 2.1% | 2.9%(-0.756)#529 | 3.1%(-0.922)#21,321 |
| 2. | 20152 | 0.79% | 2.9%(-2.11)#663 | 3.1%(-2.28)#26,532 |
1
Common Questions
What are the Top Zip Codes with the Highest Percentage of Population Employed in Installation, Maintenance & Repair in Chantilly, VA?
Top Zip Codes with the Highest Percentage of Population Employed in Installation, Maintenance & Repair in Chantilly, VA are:
What zip code has the Highest Percentage of Population Employed in Installation, Maintenance & Repair in Chantilly, VA?
20151 has the Highest Percentage of Population Employed in Installation, Maintenance & Repair in Chantilly, VA with 2.1%.
What is the Percentage of Population Employed in Installation, Maintenance & Repair in Chantilly, VA?
Percentage of Population Employed in Installation, Maintenance & Repair in Chantilly is 2.1%.
What is the Percentage of Population Employed in Installation, Maintenance & Repair in Virginia?
Percentage of Population Employed in Installation, Maintenance & Repair in Virginia is 2.9%.
What is the Percentage of Population Employed in Installation, Maintenance & Repair in the United States?
Percentage of Population Employed in Installation, Maintenance & Repair in the United States is 3.1%.