Pueblo vs Immigrants from England Unemployment Among Women with Children Ages 6 to 17 years

COMPARE

Pueblo
Race
Ancestry
AfghanAfricanAlaska NativeAlaskan AthabascanAlbanianAleutAlsatianAmericanApacheArabArapahoArgentineanArmenianAssyrian/Chaldean/SyriacAustralianAustrianBahamianBangladeshiBarbadianBasqueBelgianBelizeanBermudanBhutaneseBlackfeetBolivianBrazilianBritishBritish West IndianBulgarianBurmeseCajunCambodianCanadianCape VerdeanCarpatho RusynCelticCentral AmericanCentral American IndianCherokeeCheyenneChickasawChileanChineseChippewaChoctawColombianColvilleComancheCosta RicanCreeCreekCroatianCrowCubanCypriotCzechCzechoslovakianDanishDelawareDominicanDutchDutch West IndianEastern EuropeanEcuadorianEgyptianEnglishEstonianEthiopianEuropeanFijianFilipinoFinnishFrenchFrench American IndianFrench CanadianGermanGerman RussianGhanaianGreekGuamanian/ChamorroGuatemalanGuyaneseHaitianHmongHonduranHopiHoumaHungarianIcelanderIndian (Asian)IndonesianInupiatIranianIraqiIrishIroquoisIsraeliItalianJamaicanJapaneseJordanianKenyanKiowaKoreanLaotianLatvianLebaneseLiberianLithuanianLumbeeLuxembourgerMacedonianMalaysianMalteseMarshalleseMenomineeMexicanMexican American IndianMongolianMoroccanNative HawaiianNavajoNepaleseNew ZealanderNicaraguanNigerianNorthern EuropeanNorwegianOkinawanOsageOttawaPaiutePakistaniPalestinianPanamanianParaguayanPennsylvania GermanPeruvianPimaPolishPortuguesePotawatomiPuebloPuerto RicanPuget Sound SalishRomanianRussianSalvadoranSamoanScandinavianScotch-IrishScottishSeminoleSenegaleseSerbianShoshoneSierra LeoneanSiouxSlavicSlovakSloveneSomaliSouth AfricanSouth AmericanSouth American IndianSoviet UnionSpaniardSpanishSpanish AmericanSpanish American IndianSri LankanSubsaharan AfricanSudaneseSwedishSwissSyrianTaiwaneseThaiTlingit-HaidaTohono O'OdhamTonganTrinidadian and TobagonianTsimshianTurkishU.S. Virgin IslanderUgandanUkrainianUruguayanUteVenezuelanVietnameseWelshWest IndianYakamaYaquiYugoslavianYumanYup'ikZimbabwean
Immigration
NonimmigrantsImmigrantsAfghanistanAfricaAlbaniaArgentinaArmeniaAsiaAustraliaAustriaBahamasBangladeshBarbadosBelarusBelgiumBelizeBoliviaBosnia and HerzegovinaBrazilBulgariaBurma/MyanmarCabo VerdeCambodiaCameroonCanadaCaribbeanCentral AmericaChileChinaColombiaCongoCosta RicaCroatiaCubaCzechoslovakiaDenmarkDominicaDominican RepublicEastern AfricaEastern AsiaEastern EuropeEcuadorEgyptEl SalvadorEritreaEthiopiaEuropeFijiFranceGermanyGhanaGreeceGrenadaGuatemalaGuyanaHaitiHondurasHong KongHungaryIndiaIndonesiaIranIraqIrelandIsraelItalyJamaicaJapanJordanKazakhstanKenyaKoreaKuwaitLaosLatin AmericaLatviaLebanonLiberiaLithuaniaMalaysiaMexicoMicronesiaMiddle AfricaMoldovaMoroccoNepalNetherlandsNicaraguaNigeriaNorth AmericaNorth MacedoniaNorthern AfricaNorthern EuropeNorwayOceaniaPakistanPanamaPeruPhilippinesPolandPortugalRomaniaRussiaSaudi ArabiaScotlandSenegalSerbiaSierra LeoneSingaporeSomaliaSouth AfricaSouth AmericaSouth Central AsiaSouth Eastern AsiaSouthern EuropeSpainSri LankaSt. Vincent and the GrenadinesSudanSwedenSwitzerlandSyriaTaiwanThailandTrinidad and TobagoTurkeyUgandaUkraineUruguayUzbekistanVenezuelaVietnamWest IndiesWestern AfricaWestern AsiaWestern EuropeYemenZaireZimbabweAzores
Immigrants from England
Race
Ancestry
AfghanAfricanAlaska NativeAlaskan AthabascanAlbanianAleutAlsatianAmericanApacheArabArapahoArgentineanArmenianAssyrian/Chaldean/SyriacAustralianAustrianBahamianBangladeshiBarbadianBasqueBelgianBelizeanBermudanBhutaneseBlackfeetBolivianBrazilianBritishBritish West IndianBulgarianBurmeseCajunCambodianCanadianCape VerdeanCarpatho RusynCelticCentral AmericanCentral American IndianCherokeeCheyenneChickasawChileanChineseChippewaChoctawColombianColvilleComancheCosta RicanCreeCreekCroatianCrowCubanCypriotCzechCzechoslovakianDanishDelawareDominicanDutchDutch West IndianEastern EuropeanEcuadorianEgyptianEnglishEstonianEthiopianEuropeanFijianFilipinoFinnishFrenchFrench American IndianFrench CanadianGermanGerman RussianGhanaianGreekGuamanian/ChamorroGuatemalanGuyaneseHaitianHmongHonduranHopiHoumaHungarianIcelanderIndian (Asian)IndonesianInupiatIranianIraqiIrishIroquoisIsraeliItalianJamaicanJapaneseJordanianKenyanKiowaKoreanLaotianLatvianLebaneseLiberianLithuanianLumbeeLuxembourgerMacedonianMalaysianMalteseMarshalleseMenomineeMexicanMexican American IndianMongolianMoroccanNative HawaiianNavajoNepaleseNew ZealanderNicaraguanNigerianNorthern EuropeanNorwegianOkinawanOsageOttawaPaiutePakistaniPalestinianPanamanianParaguayanPennsylvania GermanPeruvianPimaPolishPortuguesePotawatomiPuerto RicanPuget Sound SalishRomanianRussianSalvadoranSamoanScandinavianScotch-IrishScottishSeminoleSenegaleseSerbianShoshoneSierra LeoneanSiouxSlavicSlovakSloveneSomaliSouth AfricanSouth AmericanSouth American IndianSoviet UnionSpaniardSpanishSpanish AmericanSpanish American IndianSri LankanSubsaharan AfricanSudaneseSwedishSwissSyrianTaiwaneseThaiTlingit-HaidaTohono O'OdhamTonganTrinidadian and TobagonianTsimshianTurkishU.S. Virgin IslanderUgandanUkrainianUruguayanUteVenezuelanVietnameseWelshWest IndianYakamaYaquiYugoslavianYumanYup'ikZimbabwean
Immigration
NonimmigrantsImmigrantsAfghanistanAfricaAlbaniaArgentinaArmeniaAsiaAustraliaAustriaBahamasBangladeshBarbadosBelarusBelgiumBelizeBoliviaBosnia and HerzegovinaBrazilBulgariaBurma/MyanmarCabo VerdeCambodiaCameroonCanadaCaribbeanCentral AmericaChileChinaColombiaCongoCosta RicaCroatiaCubaCzechoslovakiaDenmarkDominicaDominican RepublicEastern AfricaEastern AsiaEastern EuropeEcuadorEgyptEl SalvadorEnglandEritreaEthiopiaEuropeFijiFranceGermanyGhanaGreeceGrenadaGuatemalaGuyanaHaitiHondurasHong KongHungaryIndiaIndonesiaIranIraqIrelandIsraelItalyJamaicaJapanJordanKazakhstanKenyaKoreaKuwaitLaosLatin AmericaLatviaLebanonLiberiaLithuaniaMalaysiaMexicoMicronesiaMiddle AfricaMoldovaMoroccoNepalNetherlandsNicaraguaNigeriaNorth AmericaNorth MacedoniaNorthern AfricaNorthern EuropeNorwayOceaniaPakistanPanamaPeruPhilippinesPolandPortugalRomaniaRussiaSaudi ArabiaScotlandSenegalSerbiaSierra LeoneSingaporeSomaliaSouth AfricaSouth AmericaSouth Central AsiaSouth Eastern AsiaSouthern EuropeSpainSri LankaSt. Vincent and the GrenadinesSudanSwedenSwitzerlandSyriaTaiwanThailandTrinidad and TobagoTurkeyUgandaUkraineUruguayUzbekistanVenezuelaVietnamWest IndiesWestern AfricaWestern AsiaWestern EuropeYemenZaireZimbabweAzores
Unemployment Among Women with Children Ages 6 to 17 years
Income
Poverty
Unemployment
Labor Participation
Family Structure
Vehicle Availability
Education Level
Disability

Unemployment Among Women with Children Ages 6 to 17 years Comparison

Pueblo

Immigrants from England

Exceptional
Average
8.6%
UNEMPLOYMENT AMONG WOMEN WITH CHILDREN AGES 6 TO 17 YEARS
96.2/ 100
METRIC RATING
118th/ 347
METRIC RANK
8.9%
UNEMPLOYMENT AMONG WOMEN WITH CHILDREN AGES 6 TO 17 YEARS
57.7/ 100
METRIC RATING
167th/ 347
METRIC RANK

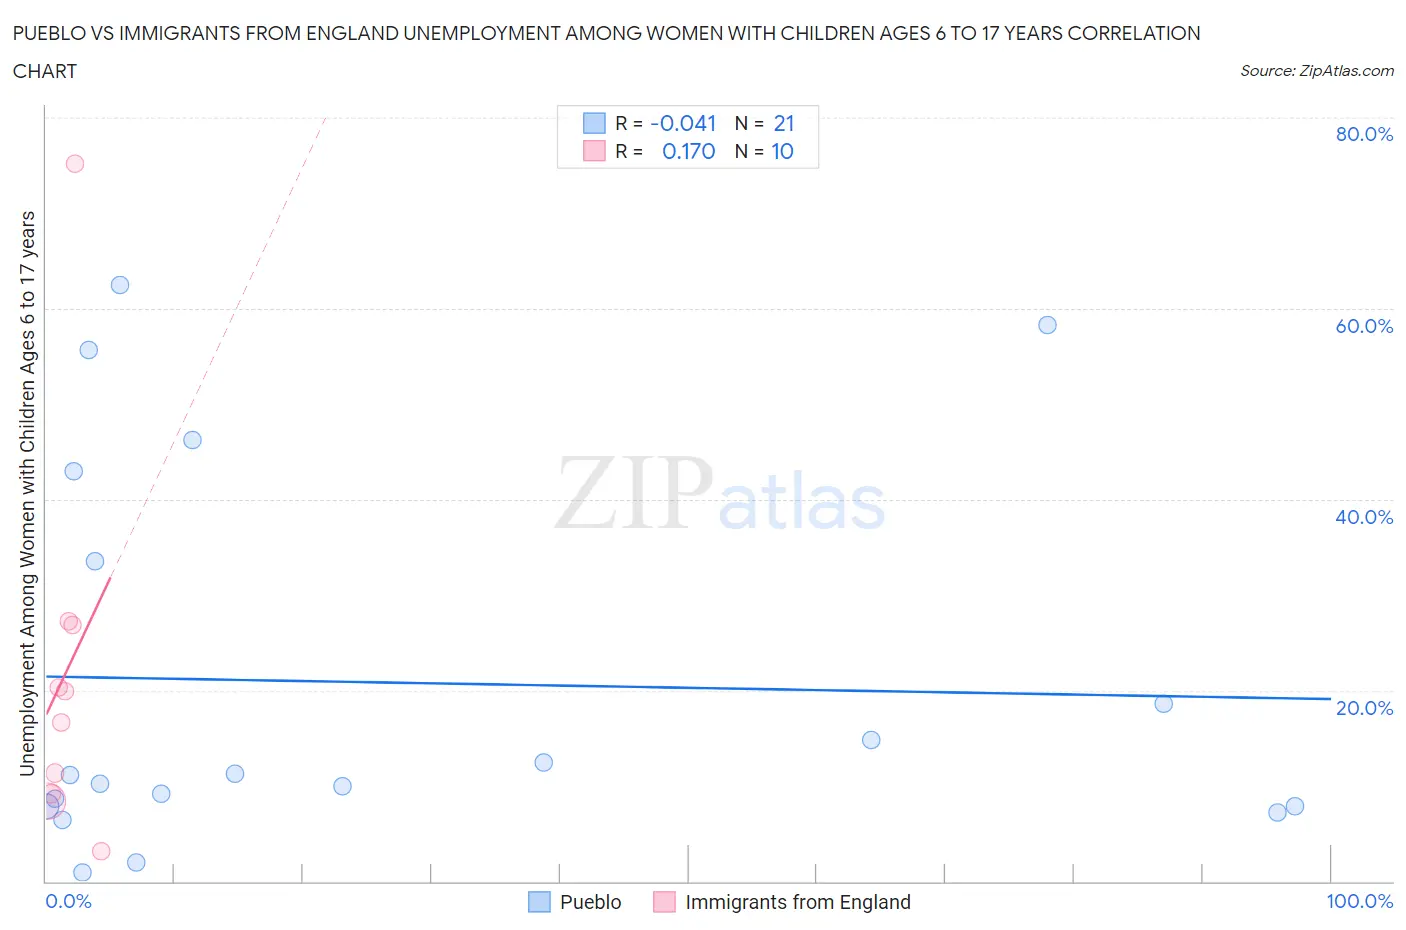
Pueblo vs Immigrants from England Unemployment Among Women with Children Ages 6 to 17 years Correlation Chart

The statistical analysis conducted on geographies consisting of 103,975,962 people shows no correlation between the proportion of Pueblo and unemployment rate among women with children between the ages 6 and 17 in the United States with a correlation coefficient (R) of -0.041 and weighted average of 8.6%. Similarly, the statistical analysis conducted on geographies consisting of 278,323,272 people shows a poor positive correlation between the proportion of Immigrants from England and unemployment rate among women with children between the ages 6 and 17 in the United States with a correlation coefficient (R) of 0.170 and weighted average of 8.9%, a difference of 3.4%.
Pueblo vs Immigrants from England Unemployment Among Women with Children Ages 6 to 17 years

Unemployment Among Women with Children Ages 6 to 17 years Correlation Summary

MeasurementPuebloImmigrants from England
Minimum0.90%3.1%
Maximum62.5%75.1%
Range61.6%72.0%
Mean20.8%21.8%
Median11.1%18.3%
Interquartile 25% (IQ1)7.8%9.2%
Interquartile 75% (IQ3)38.2%26.8%
Interquartile Range (IQR)30.4%17.7%
Standard Deviation (Sample)19.9%20.4%
Standard Deviation (Population)19.4%19.3%

Similar Demographics by Unemployment Among Women with Children Ages 6 to 17 years

Demographics Similar to Pueblo by Unemployment Among Women with Children Ages 6 to 17 years

In terms of unemployment among women with children ages 6 to 17 years, the demographic groups most similar to Pueblo are Immigrants from Grenada (8.6%, a difference of 0.010%), Albanian (8.6%, a difference of 0.030%), Zimbabwean (8.6%, a difference of 0.040%), Israeli (8.7%, a difference of 0.090%), and Argentinean (8.6%, a difference of 0.11%).
DemographicsRating | RankUnemployment Among Women with Children Ages 6 to 17 years
Immigrants | Ukraine
97.4
/100
|
#111
Exceptional
8.6%
Romanians
97.1
/100
|
#112
Exceptional
8.6%
Eastern Europeans
96.8
/100
|
#113
Exceptional
8.6%
Immigrants | Russia
96.7
/100
|
#114
Exceptional
8.6%
Argentineans
96.5
/100
|
#115
Exceptional
8.6%
Zimbabweans
96.3
/100
|
#116
Exceptional
8.6%
Albanians
96.3
/100
|
#117
Exceptional
8.6%
Pueblo
96.2
/100
|
#118
Exceptional
8.6%
Immigrants | Grenada
96.2
/100
|
#119
Exceptional
8.6%
Israelis
95.9
/100
|
#120
Exceptional
8.7%
Immigrants | Denmark
95.5
/100
|
#121
Exceptional
8.7%
Immigrants | Egypt
95.0
/100
|
#122
Exceptional
8.7%
Immigrants | Morocco
94.9
/100
|
#123
Exceptional
8.7%
Immigrants | Lebanon
94.9
/100
|
#124
Exceptional
8.7%
South Africans
94.6
/100
|
#125
Exceptional
8.7%

Demographics Similar to Immigrants from England by Unemployment Among Women with Children Ages 6 to 17 years

In terms of unemployment among women with children ages 6 to 17 years, the demographic groups most similar to Immigrants from England are Moroccan (8.9%, a difference of 0.030%), Immigrants from Croatia (8.9%, a difference of 0.030%), Immigrants from Micronesia (8.9%, a difference of 0.070%), Ukrainian (8.9%, a difference of 0.090%), and British (8.9%, a difference of 0.11%).
DemographicsRating | RankUnemployment Among Women with Children Ages 6 to 17 years
Immigrants | Hungary
63.4
/100
|
#160
Good
8.9%
Immigrants | Guyana
63.0
/100
|
#161
Good
8.9%
Immigrants | Netherlands
60.8
/100
|
#162
Good
8.9%
Mexican American Indians
60.6
/100
|
#163
Good
8.9%
Ukrainians
59.7
/100
|
#164
Average
8.9%
Immigrants | Micronesia
59.2
/100
|
#165
Average
8.9%
Moroccans
58.3
/100
|
#166
Average
8.9%
Immigrants | England
57.7
/100
|
#167
Average
8.9%
Immigrants | Croatia
57.1
/100
|
#168
Average
8.9%
British
55.2
/100
|
#169
Average
8.9%
Turks
54.1
/100
|
#170
Average
8.9%
Jordanians
52.2
/100
|
#171
Average
9.0%
Immigrants | West Indies
52.2
/100
|
#172
Average
9.0%
Immigrants | Brazil
51.0
/100
|
#173
Average
9.0%
Immigrants | Costa Rica
50.0
/100
|
#174
Average
9.0%