Immigrants from Western Asia vs Icelander Unemployment Among Women with Children Ages 6 to 17 years
COMPARE
Immigrants from Western Asia
Icelander
Unemployment Among Women with Children Ages 6 to 17 years
Unemployment Among Women with Children Ages 6 to 17 years Comparison
Immigrants from Western Asia
Icelanders
8.7%
UNEMPLOYMENT AMONG WOMEN WITH CHILDREN AGES 6 TO 17 YEARS
93.1/ 100
METRIC RATING
130th/ 347
METRIC RANK
8.1%
UNEMPLOYMENT AMONG WOMEN WITH CHILDREN AGES 6 TO 17 YEARS
100.0/ 100
METRIC RATING
46th/ 347
METRIC RANK
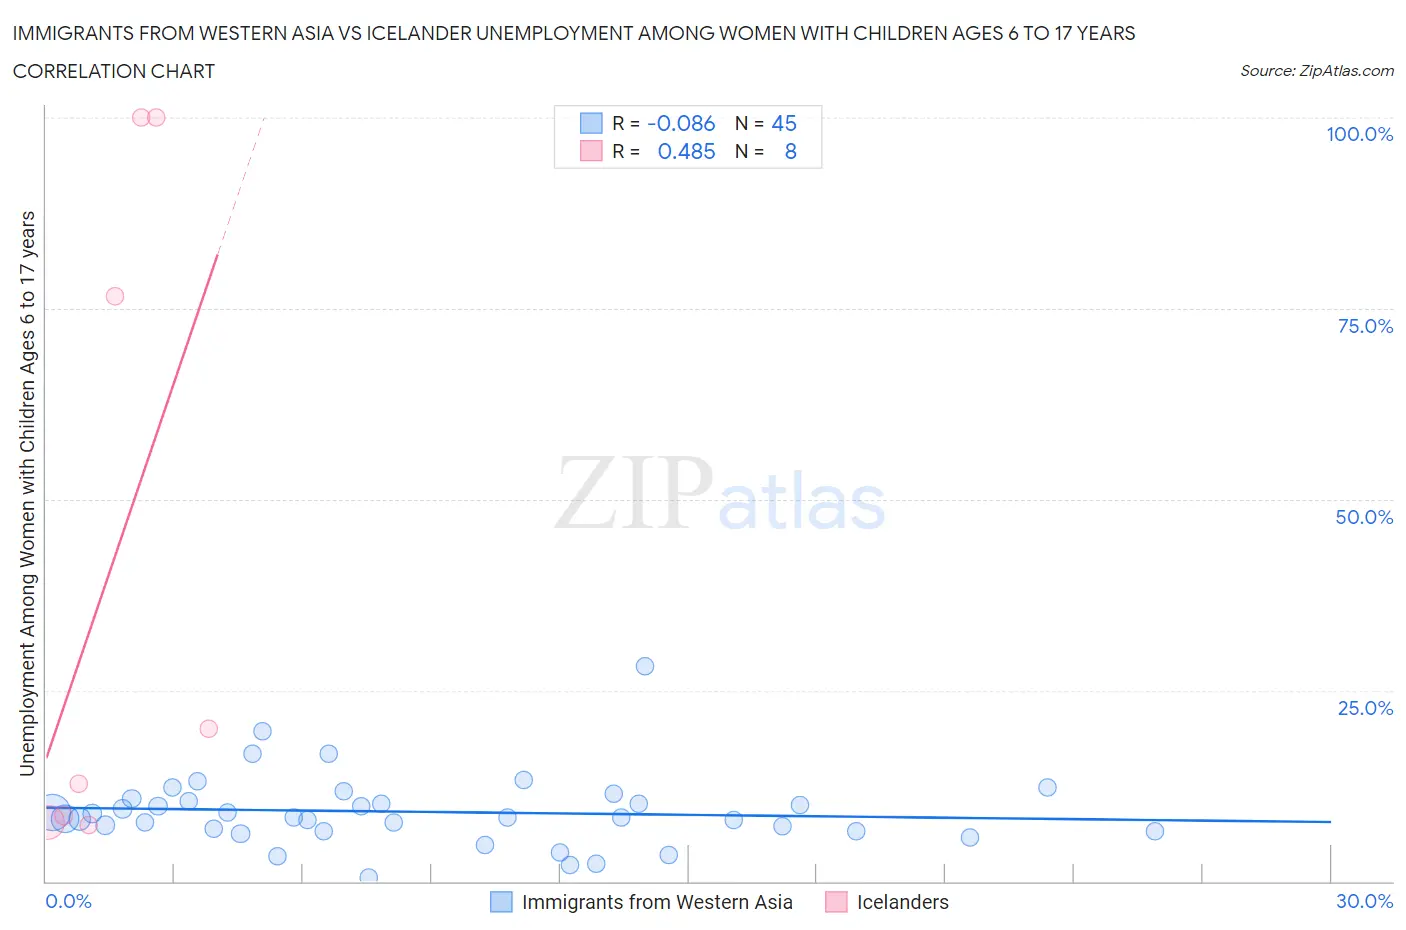
Immigrants from Western Asia vs Icelander Unemployment Among Women with Children Ages 6 to 17 years Correlation Chart
The statistical analysis conducted on geographies consisting of 289,779,940 people shows a slight negative correlation between the proportion of Immigrants from Western Asia and unemployment rate among women with children between the ages 6 and 17 in the United States with a correlation coefficient (R) of -0.086 and weighted average of 8.7%. Similarly, the statistical analysis conducted on geographies consisting of 127,654,017 people shows a moderate positive correlation between the proportion of Icelanders and unemployment rate among women with children between the ages 6 and 17 in the United States with a correlation coefficient (R) of 0.485 and weighted average of 8.1%, a difference of 7.9%.
Unemployment Among Women with Children Ages 6 to 17 years Correlation Summary
| Measurement | Immigrants from Western Asia | Icelander |
| Minimum | 0.50% | 7.3% |
| Maximum | 28.1% | 100.0% |
| Range | 27.6% | 92.7% |
| Mean | 9.1% | 41.6% |
| Median | 8.4% | 16.4% |
| Interquartile 25% (IQ1) | 6.6% | 8.1% |
| Interquartile 75% (IQ3) | 10.7% | 88.3% |
| Interquartile Range (IQR) | 4.1% | 80.2% |
| Standard Deviation (Sample) | 4.8% | 42.7% |
| Standard Deviation (Population) | 4.7% | 39.9% |
Similar Demographics by Unemployment Among Women with Children Ages 6 to 17 years
Demographics Similar to Immigrants from Western Asia by Unemployment Among Women with Children Ages 6 to 17 years
In terms of unemployment among women with children ages 6 to 17 years, the demographic groups most similar to Immigrants from Western Asia are Barbadian (8.7%, a difference of 0.14%), Slavic (8.7%, a difference of 0.15%), Yaqui (8.7%, a difference of 0.16%), Egyptian (8.7%, a difference of 0.22%), and Hmong (8.7%, a difference of 0.24%).
| Demographics | Rating | Rank | Unemployment Among Women with Children Ages 6 to 17 years |
| Immigrants | Morocco | 94.9 /100 | #123 | Exceptional 8.7% |
| Immigrants | Lebanon | 94.9 /100 | #124 | Exceptional 8.7% |
| South Africans | 94.6 /100 | #125 | Exceptional 8.7% |
| Immigrants | Northern Africa | 94.4 /100 | #126 | Exceptional 8.7% |
| Czechs | 94.4 /100 | #127 | Exceptional 8.7% |
| Hmong | 94.3 /100 | #128 | Exceptional 8.7% |
| Barbadians | 93.8 /100 | #129 | Exceptional 8.7% |
| Immigrants | Western Asia | 93.1 /100 | #130 | Exceptional 8.7% |
| Slavs | 92.2 /100 | #131 | Exceptional 8.7% |
| Yaqui | 92.2 /100 | #132 | Exceptional 8.7% |
| Egyptians | 91.8 /100 | #133 | Exceptional 8.7% |
| Immigrants | Ireland | 91.0 /100 | #134 | Exceptional 8.7% |
| Europeans | 90.6 /100 | #135 | Exceptional 8.7% |
| Immigrants | Latvia | 90.4 /100 | #136 | Exceptional 8.7% |
| Immigrants | Argentina | 90.0 /100 | #137 | Excellent 8.7% |
Demographics Similar to Icelanders by Unemployment Among Women with Children Ages 6 to 17 years
In terms of unemployment among women with children ages 6 to 17 years, the demographic groups most similar to Icelanders are Immigrants from Bulgaria (8.1%, a difference of 0.020%), Immigrants from Switzerland (8.1%, a difference of 0.040%), Immigrants from Sweden (8.1%, a difference of 0.060%), Bhutanese (8.1%, a difference of 0.10%), and Immigrants from Asia (8.1%, a difference of 0.17%).
| Demographics | Rating | Rank | Unemployment Among Women with Children Ages 6 to 17 years |
| Somalis | 100.0 /100 | #39 | Exceptional 8.0% |
| Immigrants | Zimbabwe | 100.0 /100 | #40 | Exceptional 8.0% |
| Iranians | 100.0 /100 | #41 | Exceptional 8.0% |
| Immigrants | Somalia | 100.0 /100 | #42 | Exceptional 8.0% |
| Bhutanese | 100.0 /100 | #43 | Exceptional 8.1% |
| Immigrants | Sweden | 100.0 /100 | #44 | Exceptional 8.1% |
| Immigrants | Bulgaria | 100.0 /100 | #45 | Exceptional 8.1% |
| Icelanders | 100.0 /100 | #46 | Exceptional 8.1% |
| Immigrants | Switzerland | 100.0 /100 | #47 | Exceptional 8.1% |
| Immigrants | Asia | 100.0 /100 | #48 | Exceptional 8.1% |
| Immigrants | Oceania | 100.0 /100 | #49 | Exceptional 8.1% |
| Hawaiians | 100.0 /100 | #50 | Exceptional 8.1% |
| Immigrants | Sudan | 100.0 /100 | #51 | Exceptional 8.1% |
| Immigrants | Iraq | 100.0 /100 | #52 | Exceptional 8.1% |
| Danes | 100.0 /100 | #53 | Exceptional 8.1% |