Immigrants from Sudan vs Immigrants from Scotland Unemployment Among Women with Children Ages 6 to 17 years
COMPARE
Immigrants from Sudan
Immigrants from Scotland
Unemployment Among Women with Children Ages 6 to 17 years
Unemployment Among Women with Children Ages 6 to 17 years Comparison
Immigrants from Sudan
Immigrants from Scotland
8.1%
UNEMPLOYMENT AMONG WOMEN WITH CHILDREN AGES 6 TO 17 YEARS
100.0/ 100
METRIC RATING
51st/ 347
METRIC RANK
9.2%
UNEMPLOYMENT AMONG WOMEN WITH CHILDREN AGES 6 TO 17 YEARS
6.6/ 100
METRIC RATING
219th/ 347
METRIC RANK
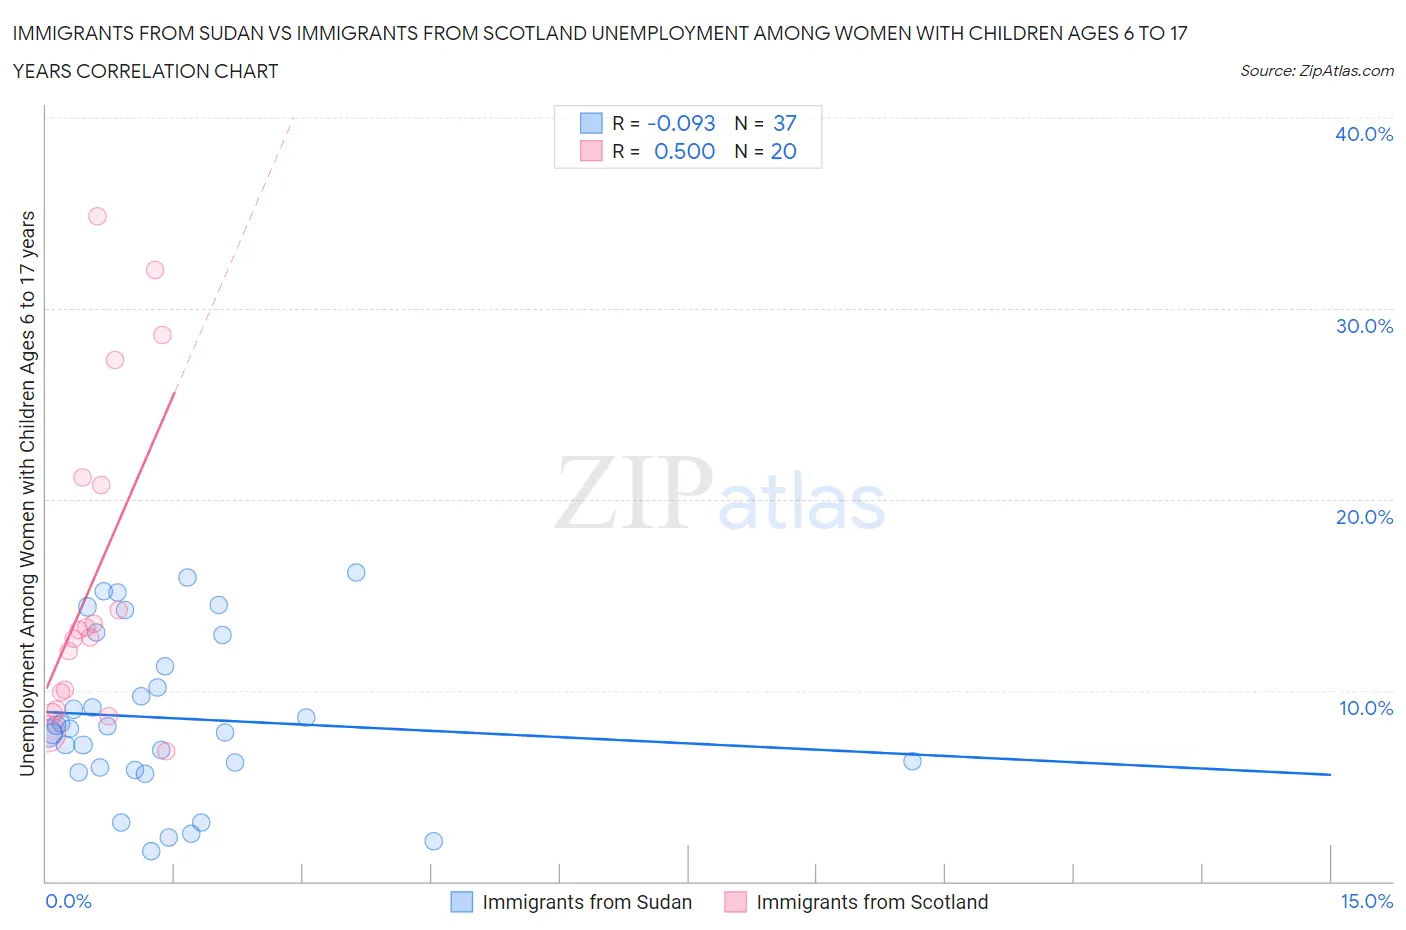
Immigrants from Sudan vs Immigrants from Scotland Unemployment Among Women with Children Ages 6 to 17 years Correlation Chart
The statistical analysis conducted on geographies consisting of 106,002,308 people shows a slight negative correlation between the proportion of Immigrants from Sudan and unemployment rate among women with children between the ages 6 and 17 in the United States with a correlation coefficient (R) of -0.093 and weighted average of 8.1%. Similarly, the statistical analysis conducted on geographies consisting of 154,369,144 people shows a moderate positive correlation between the proportion of Immigrants from Scotland and unemployment rate among women with children between the ages 6 and 17 in the United States with a correlation coefficient (R) of 0.500 and weighted average of 9.2%, a difference of 13.8%.
Unemployment Among Women with Children Ages 6 to 17 years Correlation Summary
| Measurement | Immigrants from Sudan | Immigrants from Scotland |
| Minimum | 1.6% | 6.8% |
| Maximum | 16.2% | 34.9% |
| Range | 14.6% | 28.1% |
| Mean | 8.6% | 15.9% |
| Median | 8.0% | 13.0% |
| Interquartile 25% (IQ1) | 5.9% | 9.4% |
| Interquartile 75% (IQ3) | 12.1% | 20.9% |
| Interquartile Range (IQR) | 6.2% | 11.5% |
| Standard Deviation (Sample) | 4.2% | 8.6% |
| Standard Deviation (Population) | 4.1% | 8.3% |
Similar Demographics by Unemployment Among Women with Children Ages 6 to 17 years
Demographics Similar to Immigrants from Sudan by Unemployment Among Women with Children Ages 6 to 17 years
In terms of unemployment among women with children ages 6 to 17 years, the demographic groups most similar to Immigrants from Sudan are Hawaiian (8.1%, a difference of 0.18%), Immigrants from Oceania (8.1%, a difference of 0.28%), Immigrants from Iraq (8.1%, a difference of 0.30%), Immigrants from Asia (8.1%, a difference of 0.34%), and Danish (8.1%, a difference of 0.37%).
| Demographics | Rating | Rank | Unemployment Among Women with Children Ages 6 to 17 years |
| Immigrants | Sweden | 100.0 /100 | #44 | Exceptional 8.1% |
| Immigrants | Bulgaria | 100.0 /100 | #45 | Exceptional 8.1% |
| Icelanders | 100.0 /100 | #46 | Exceptional 8.1% |
| Immigrants | Switzerland | 100.0 /100 | #47 | Exceptional 8.1% |
| Immigrants | Asia | 100.0 /100 | #48 | Exceptional 8.1% |
| Immigrants | Oceania | 100.0 /100 | #49 | Exceptional 8.1% |
| Hawaiians | 100.0 /100 | #50 | Exceptional 8.1% |
| Immigrants | Sudan | 100.0 /100 | #51 | Exceptional 8.1% |
| Immigrants | Iraq | 100.0 /100 | #52 | Exceptional 8.1% |
| Danes | 100.0 /100 | #53 | Exceptional 8.1% |
| Immigrants | Armenia | 100.0 /100 | #54 | Exceptional 8.2% |
| Immigrants | Japan | 100.0 /100 | #55 | Exceptional 8.2% |
| Immigrants | Bosnia and Herzegovina | 100.0 /100 | #56 | Exceptional 8.2% |
| Immigrants | Laos | 100.0 /100 | #57 | Exceptional 8.2% |
| Immigrants | Malaysia | 100.0 /100 | #58 | Exceptional 8.2% |
Demographics Similar to Immigrants from Scotland by Unemployment Among Women with Children Ages 6 to 17 years
In terms of unemployment among women with children ages 6 to 17 years, the demographic groups most similar to Immigrants from Scotland are Belgian (9.2%, a difference of 0.030%), Syrian (9.2%, a difference of 0.050%), German (9.2%, a difference of 0.10%), Immigrants from Germany (9.2%, a difference of 0.11%), and Immigrants from Uruguay (9.2%, a difference of 0.11%).
| Demographics | Rating | Rank | Unemployment Among Women with Children Ages 6 to 17 years |
| Peruvians | 9.0 /100 | #212 | Tragic 9.2% |
| Spaniards | 8.2 /100 | #213 | Tragic 9.2% |
| Iroquois | 7.5 /100 | #214 | Tragic 9.2% |
| Immigrants | Germany | 7.2 /100 | #215 | Tragic 9.2% |
| Immigrants | Uruguay | 7.2 /100 | #216 | Tragic 9.2% |
| Germans | 7.2 /100 | #217 | Tragic 9.2% |
| Syrians | 6.9 /100 | #218 | Tragic 9.2% |
| Immigrants | Scotland | 6.6 /100 | #219 | Tragic 9.2% |
| Belgians | 6.4 /100 | #220 | Tragic 9.2% |
| Crow | 5.8 /100 | #221 | Tragic 9.2% |
| Immigrants | Southern Europe | 5.8 /100 | #222 | Tragic 9.2% |
| Immigrants | Eritrea | 5.8 /100 | #223 | Tragic 9.2% |
| Immigrants | El Salvador | 5.3 /100 | #224 | Tragic 9.3% |
| Chinese | 5.2 /100 | #225 | Tragic 9.3% |
| Immigrants | Azores | 4.6 /100 | #226 | Tragic 9.3% |