Immigrants from Poland vs Eastern European Unemployment Among Women with Children Ages 6 to 17 years
COMPARE
Immigrants from Poland
Eastern European
Unemployment Among Women with Children Ages 6 to 17 years
Unemployment Among Women with Children Ages 6 to 17 years Comparison
Immigrants from Poland
Eastern Europeans
8.8%
UNEMPLOYMENT AMONG WOMEN WITH CHILDREN AGES 6 TO 17 YEARS
88.3/ 100
METRIC RATING
140th/ 347
METRIC RANK
8.6%
UNEMPLOYMENT AMONG WOMEN WITH CHILDREN AGES 6 TO 17 YEARS
96.8/ 100
METRIC RATING
113th/ 347
METRIC RANK
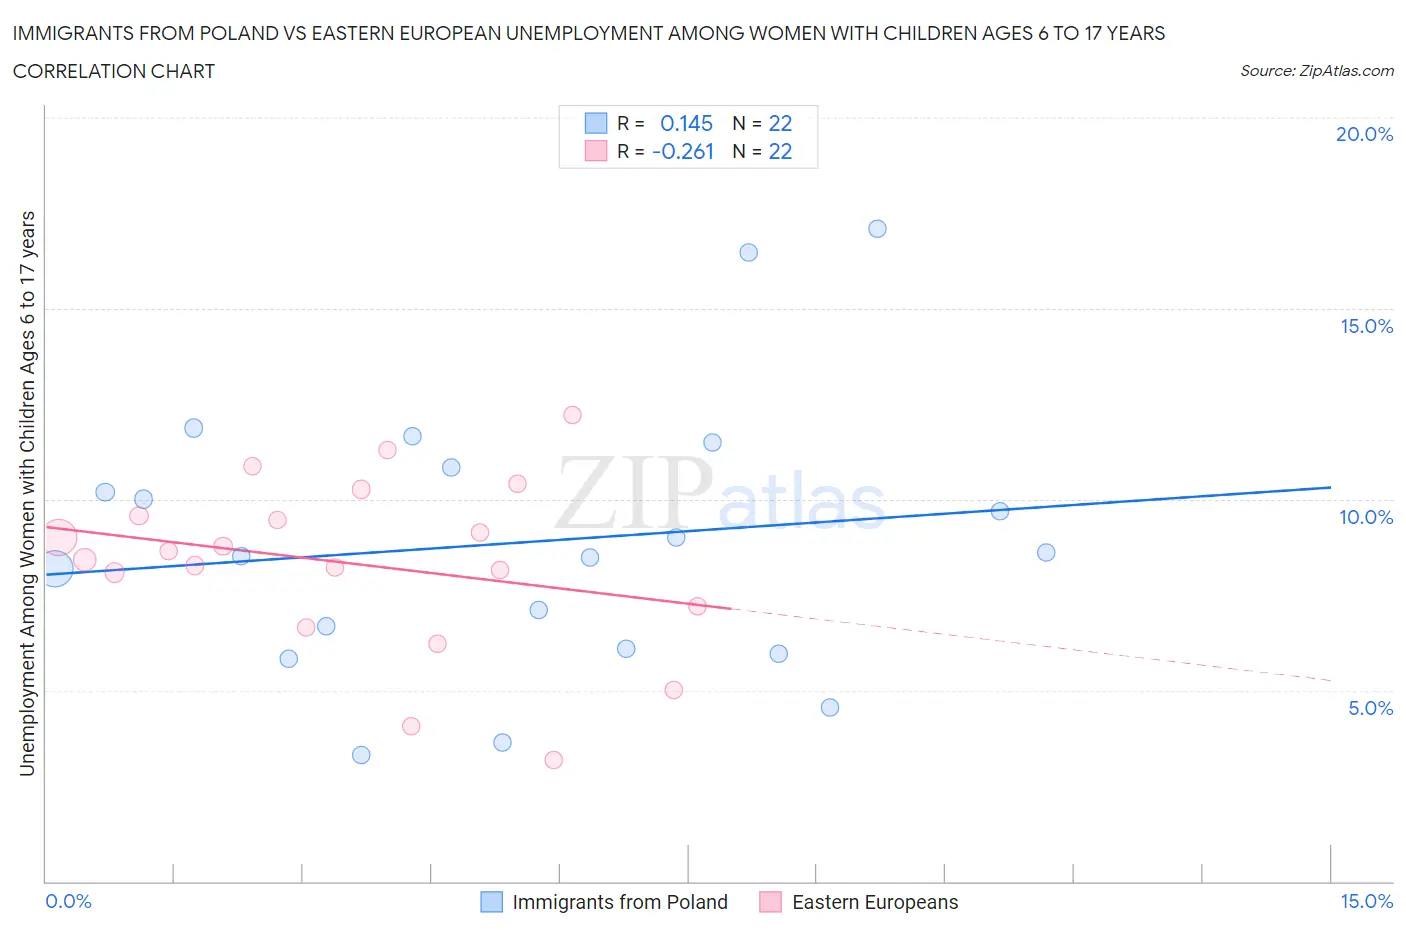
Immigrants from Poland vs Eastern European Unemployment Among Women with Children Ages 6 to 17 years Correlation Chart
The statistical analysis conducted on geographies consisting of 224,450,352 people shows a poor positive correlation between the proportion of Immigrants from Poland and unemployment rate among women with children between the ages 6 and 17 in the United States with a correlation coefficient (R) of 0.145 and weighted average of 8.8%. Similarly, the statistical analysis conducted on geographies consisting of 307,747,219 people shows a weak negative correlation between the proportion of Eastern Europeans and unemployment rate among women with children between the ages 6 and 17 in the United States with a correlation coefficient (R) of -0.261 and weighted average of 8.6%, a difference of 1.6%.
Unemployment Among Women with Children Ages 6 to 17 years Correlation Summary
| Measurement | Immigrants from Poland | Eastern European |
| Minimum | 3.3% | 3.2% |
| Maximum | 17.1% | 12.2% |
| Range | 13.8% | 9.0% |
| Mean | 8.9% | 8.3% |
| Median | 8.5% | 8.5% |
| Interquartile 25% (IQ1) | 6.1% | 7.2% |
| Interquartile 75% (IQ3) | 10.8% | 9.6% |
| Interquartile Range (IQR) | 4.7% | 2.4% |
| Standard Deviation (Sample) | 3.6% | 2.3% |
| Standard Deviation (Population) | 3.5% | 2.2% |
Similar Demographics by Unemployment Among Women with Children Ages 6 to 17 years
Demographics Similar to Immigrants from Poland by Unemployment Among Women with Children Ages 6 to 17 years
In terms of unemployment among women with children ages 6 to 17 years, the demographic groups most similar to Immigrants from Poland are Serbian (8.8%, a difference of 0.070%), Immigrants from Austria (8.8%, a difference of 0.080%), Northern European (8.8%, a difference of 0.11%), Immigrants from Ethiopia (8.8%, a difference of 0.14%), and Immigrants from Argentina (8.7%, a difference of 0.20%).
| Demographics | Rating | Rank | Unemployment Among Women with Children Ages 6 to 17 years |
| Egyptians | 91.8 /100 | #133 | Exceptional 8.7% |
| Immigrants | Ireland | 91.0 /100 | #134 | Exceptional 8.7% |
| Europeans | 90.6 /100 | #135 | Exceptional 8.7% |
| Immigrants | Latvia | 90.4 /100 | #136 | Exceptional 8.7% |
| Immigrants | Argentina | 90.0 /100 | #137 | Excellent 8.7% |
| Immigrants | Ethiopia | 89.5 /100 | #138 | Excellent 8.8% |
| Northern Europeans | 89.2 /100 | #139 | Excellent 8.8% |
| Immigrants | Poland | 88.3 /100 | #140 | Excellent 8.8% |
| Serbians | 87.6 /100 | #141 | Excellent 8.8% |
| Immigrants | Austria | 87.5 /100 | #142 | Excellent 8.8% |
| Immigrants | Kenya | 86.1 /100 | #143 | Excellent 8.8% |
| Russians | 85.8 /100 | #144 | Excellent 8.8% |
| Kenyans | 85.6 /100 | #145 | Excellent 8.8% |
| Chileans | 80.8 /100 | #146 | Excellent 8.8% |
| Immigrants | Bangladesh | 79.4 /100 | #147 | Good 8.8% |
Demographics Similar to Eastern Europeans by Unemployment Among Women with Children Ages 6 to 17 years
In terms of unemployment among women with children ages 6 to 17 years, the demographic groups most similar to Eastern Europeans are Immigrants from Russia (8.6%, a difference of 0.010%), Argentinean (8.6%, a difference of 0.080%), Romanian (8.6%, a difference of 0.15%), Zimbabwean (8.6%, a difference of 0.15%), and Albanian (8.6%, a difference of 0.16%).
| Demographics | Rating | Rank | Unemployment Among Women with Children Ages 6 to 17 years |
| Immigrants | Serbia | 97.7 /100 | #106 | Exceptional 8.6% |
| Chickasaw | 97.6 /100 | #107 | Exceptional 8.6% |
| Swedes | 97.6 /100 | #108 | Exceptional 8.6% |
| Immigrants | Romania | 97.5 /100 | #109 | Exceptional 8.6% |
| Latvians | 97.4 /100 | #110 | Exceptional 8.6% |
| Immigrants | Ukraine | 97.4 /100 | #111 | Exceptional 8.6% |
| Romanians | 97.1 /100 | #112 | Exceptional 8.6% |
| Eastern Europeans | 96.8 /100 | #113 | Exceptional 8.6% |
| Immigrants | Russia | 96.7 /100 | #114 | Exceptional 8.6% |
| Argentineans | 96.5 /100 | #115 | Exceptional 8.6% |
| Zimbabweans | 96.3 /100 | #116 | Exceptional 8.6% |
| Albanians | 96.3 /100 | #117 | Exceptional 8.6% |
| Pueblo | 96.2 /100 | #118 | Exceptional 8.6% |
| Immigrants | Grenada | 96.2 /100 | #119 | Exceptional 8.6% |
| Israelis | 95.9 /100 | #120 | Exceptional 8.7% |