Immigrants from Bosnia and Herzegovina vs Immigrants from Cambodia Unemployment Among Women with Children Ages 6 to 17 years
COMPARE
Immigrants from Bosnia and Herzegovina
Immigrants from Cambodia
Unemployment Among Women with Children Ages 6 to 17 years
Unemployment Among Women with Children Ages 6 to 17 years Comparison
Immigrants from Bosnia and Herzegovina
Immigrants from Cambodia
8.2%
UNEMPLOYMENT AMONG WOMEN WITH CHILDREN AGES 6 TO 17 YEARS
100.0/ 100
METRIC RATING
56th/ 347
METRIC RANK
7.9%
UNEMPLOYMENT AMONG WOMEN WITH CHILDREN AGES 6 TO 17 YEARS
100.0/ 100
METRIC RATING
32nd/ 347
METRIC RANK
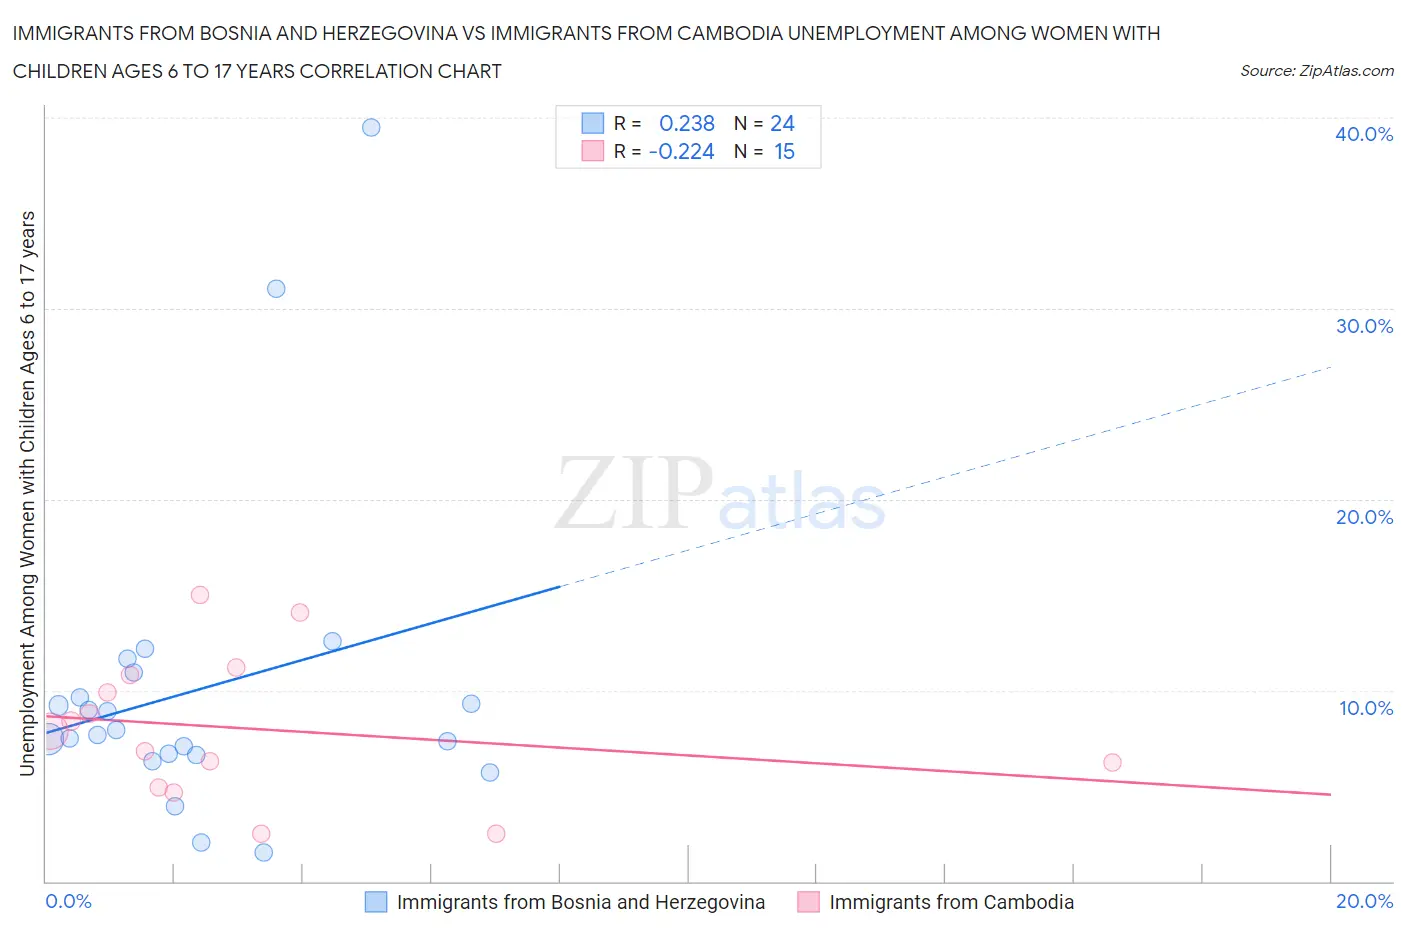
Immigrants from Bosnia and Herzegovina vs Immigrants from Cambodia Unemployment Among Women with Children Ages 6 to 17 years Correlation Chart
The statistical analysis conducted on geographies consisting of 126,697,786 people shows a weak positive correlation between the proportion of Immigrants from Bosnia and Herzegovina and unemployment rate among women with children between the ages 6 and 17 in the United States with a correlation coefficient (R) of 0.238 and weighted average of 8.2%. Similarly, the statistical analysis conducted on geographies consisting of 168,931,928 people shows a weak negative correlation between the proportion of Immigrants from Cambodia and unemployment rate among women with children between the ages 6 and 17 in the United States with a correlation coefficient (R) of -0.224 and weighted average of 7.9%, a difference of 3.1%.
Unemployment Among Women with Children Ages 6 to 17 years Correlation Summary
| Measurement | Immigrants from Bosnia and Herzegovina | Immigrants from Cambodia |
| Minimum | 1.5% | 2.5% |
| Maximum | 39.5% | 15.0% |
| Range | 38.0% | 12.5% |
| Mean | 10.1% | 8.0% |
| Median | 7.8% | 7.8% |
| Interquartile 25% (IQ1) | 6.7% | 4.9% |
| Interquartile 75% (IQ3) | 10.3% | 10.8% |
| Interquartile Range (IQR) | 3.6% | 5.9% |
| Standard Deviation (Sample) | 8.3% | 3.8% |
| Standard Deviation (Population) | 8.2% | 3.6% |
Similar Demographics by Unemployment Among Women with Children Ages 6 to 17 years
Demographics Similar to Immigrants from Bosnia and Herzegovina by Unemployment Among Women with Children Ages 6 to 17 years
In terms of unemployment among women with children ages 6 to 17 years, the demographic groups most similar to Immigrants from Bosnia and Herzegovina are Immigrants from Japan (8.2%, a difference of 0.010%), Immigrants from Laos (8.2%, a difference of 0.020%), Immigrants from Armenia (8.2%, a difference of 0.070%), Immigrants from Malaysia (8.2%, a difference of 0.21%), and Immigrants from Philippines (8.2%, a difference of 0.28%).
| Demographics | Rating | Rank | Unemployment Among Women with Children Ages 6 to 17 years |
| Immigrants | Oceania | 100.0 /100 | #49 | Exceptional 8.1% |
| Hawaiians | 100.0 /100 | #50 | Exceptional 8.1% |
| Immigrants | Sudan | 100.0 /100 | #51 | Exceptional 8.1% |
| Immigrants | Iraq | 100.0 /100 | #52 | Exceptional 8.1% |
| Danes | 100.0 /100 | #53 | Exceptional 8.1% |
| Immigrants | Armenia | 100.0 /100 | #54 | Exceptional 8.2% |
| Immigrants | Japan | 100.0 /100 | #55 | Exceptional 8.2% |
| Immigrants | Bosnia and Herzegovina | 100.0 /100 | #56 | Exceptional 8.2% |
| Immigrants | Laos | 100.0 /100 | #57 | Exceptional 8.2% |
| Immigrants | Malaysia | 100.0 /100 | #58 | Exceptional 8.2% |
| Immigrants | Philippines | 100.0 /100 | #59 | Exceptional 8.2% |
| Basques | 100.0 /100 | #60 | Exceptional 8.2% |
| Koreans | 100.0 /100 | #61 | Exceptional 8.2% |
| Spanish American Indians | 100.0 /100 | #62 | Exceptional 8.2% |
| Immigrants | South Eastern Asia | 99.9 /100 | #63 | Exceptional 8.2% |
Demographics Similar to Immigrants from Cambodia by Unemployment Among Women with Children Ages 6 to 17 years
In terms of unemployment among women with children ages 6 to 17 years, the demographic groups most similar to Immigrants from Cambodia are Laotian (7.9%, a difference of 0.050%), Immigrants from Korea (7.9%, a difference of 0.050%), Immigrants from Iran (7.9%, a difference of 0.24%), Native Hawaiian (7.9%, a difference of 0.34%), and Immigrants from South Central Asia (7.9%, a difference of 0.44%).
| Demographics | Rating | Rank | Unemployment Among Women with Children Ages 6 to 17 years |
| Immigrants | Eastern Asia | 100.0 /100 | #25 | Exceptional 7.7% |
| Indians (Asian) | 100.0 /100 | #26 | Exceptional 7.7% |
| Immigrants | Afghanistan | 100.0 /100 | #27 | Exceptional 7.8% |
| Immigrants | Uzbekistan | 100.0 /100 | #28 | Exceptional 7.8% |
| Thais | 100.0 /100 | #29 | Exceptional 7.8% |
| Immigrants | Iran | 100.0 /100 | #30 | Exceptional 7.9% |
| Laotians | 100.0 /100 | #31 | Exceptional 7.9% |
| Immigrants | Cambodia | 100.0 /100 | #32 | Exceptional 7.9% |
| Immigrants | Korea | 100.0 /100 | #33 | Exceptional 7.9% |
| Native Hawaiians | 100.0 /100 | #34 | Exceptional 7.9% |
| Immigrants | South Central Asia | 100.0 /100 | #35 | Exceptional 7.9% |
| Burmese | 100.0 /100 | #36 | Exceptional 8.0% |
| Asians | 100.0 /100 | #37 | Exceptional 8.0% |
| Alsatians | 100.0 /100 | #38 | Exceptional 8.0% |
| Somalis | 100.0 /100 | #39 | Exceptional 8.0% |