French Canadian vs Immigrants from France Unemployment Among Women with Children Ages 6 to 17 years
COMPARE
French Canadian
Immigrants from France
Unemployment Among Women with Children Ages 6 to 17 years
Unemployment Among Women with Children Ages 6 to 17 years Comparison
French Canadians
Immigrants from France
10.3%
UNEMPLOYMENT AMONG WOMEN WITH CHILDREN AGES 6 TO 17 YEARS
0.0/ 100
METRIC RATING
309th/ 347
METRIC RANK
8.6%
UNEMPLOYMENT AMONG WOMEN WITH CHILDREN AGES 6 TO 17 YEARS
98.0/ 100
METRIC RATING
104th/ 347
METRIC RANK
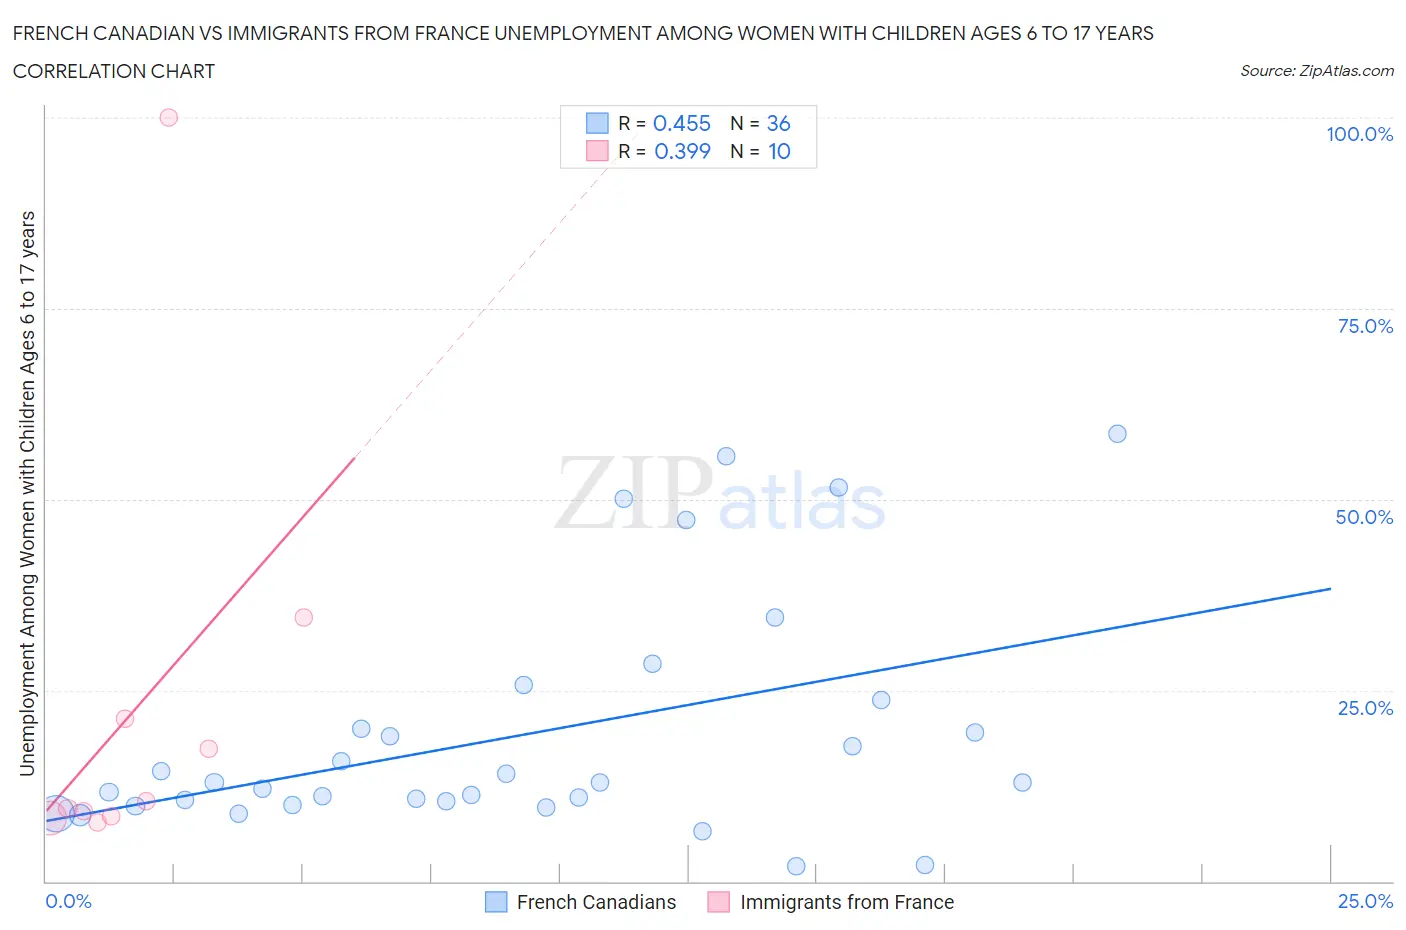
French Canadian vs Immigrants from France Unemployment Among Women with Children Ages 6 to 17 years Correlation Chart
The statistical analysis conducted on geographies consisting of 329,058,978 people shows a moderate positive correlation between the proportion of French Canadians and unemployment rate among women with children between the ages 6 and 17 in the United States with a correlation coefficient (R) of 0.455 and weighted average of 10.3%. Similarly, the statistical analysis conducted on geographies consisting of 216,894,654 people shows a mild positive correlation between the proportion of Immigrants from France and unemployment rate among women with children between the ages 6 and 17 in the United States with a correlation coefficient (R) of 0.399 and weighted average of 8.6%, a difference of 20.1%.
Unemployment Among Women with Children Ages 6 to 17 years Correlation Summary
| Measurement | French Canadian | Immigrants from France |
| Minimum | 2.0% | 7.8% |
| Maximum | 58.6% | 100.0% |
| Range | 56.6% | 92.2% |
| Mean | 19.2% | 22.7% |
| Median | 12.9% | 10.0% |
| Interquartile 25% (IQ1) | 10.2% | 8.6% |
| Interquartile 75% (IQ3) | 21.8% | 21.3% |
| Interquartile Range (IQR) | 11.6% | 12.7% |
| Standard Deviation (Sample) | 15.2% | 28.5% |
| Standard Deviation (Population) | 15.0% | 27.0% |
Similar Demographics by Unemployment Among Women with Children Ages 6 to 17 years
Demographics Similar to French Canadians by Unemployment Among Women with Children Ages 6 to 17 years
In terms of unemployment among women with children ages 6 to 17 years, the demographic groups most similar to French Canadians are Alaska Native (10.3%, a difference of 0.050%), Immigrants from Liberia (10.3%, a difference of 0.080%), Dutch West Indian (10.2%, a difference of 0.54%), Immigrants from Senegal (10.2%, a difference of 0.55%), and Paraguayan (10.2%, a difference of 0.78%).
| Demographics | Rating | Rank | Unemployment Among Women with Children Ages 6 to 17 years |
| Venezuelans | 0.0 /100 | #302 | Tragic 10.2% |
| Immigrants | Ecuador | 0.0 /100 | #303 | Tragic 10.2% |
| Immigrants | Venezuela | 0.0 /100 | #304 | Tragic 10.2% |
| Immigrants | Nigeria | 0.0 /100 | #305 | Tragic 10.2% |
| Paraguayans | 0.0 /100 | #306 | Tragic 10.2% |
| Immigrants | Senegal | 0.0 /100 | #307 | Tragic 10.2% |
| Dutch West Indians | 0.0 /100 | #308 | Tragic 10.2% |
| French Canadians | 0.0 /100 | #309 | Tragic 10.3% |
| Alaska Natives | 0.0 /100 | #310 | Tragic 10.3% |
| Immigrants | Liberia | 0.0 /100 | #311 | Tragic 10.3% |
| Africans | 0.0 /100 | #312 | Tragic 10.4% |
| Americans | 0.0 /100 | #313 | Tragic 10.4% |
| Immigrants | Cabo Verde | 0.0 /100 | #314 | Tragic 10.4% |
| Bahamians | 0.0 /100 | #315 | Tragic 10.4% |
| Immigrants | Dominica | 0.0 /100 | #316 | Tragic 10.5% |
Demographics Similar to Immigrants from France by Unemployment Among Women with Children Ages 6 to 17 years
In terms of unemployment among women with children ages 6 to 17 years, the demographic groups most similar to Immigrants from France are Immigrants from Norway (8.6%, a difference of 0.15%), Scandinavian (8.6%, a difference of 0.18%), Immigrants from South Africa (8.6%, a difference of 0.19%), Immigrants from Serbia (8.6%, a difference of 0.19%), and Immigrants from Lithuania (8.6%, a difference of 0.22%).
| Demographics | Rating | Rank | Unemployment Among Women with Children Ages 6 to 17 years |
| Bolivians | 98.5 /100 | #97 | Exceptional 8.5% |
| Malaysians | 98.5 /100 | #98 | Exceptional 8.6% |
| Immigrants | Lithuania | 98.4 /100 | #99 | Exceptional 8.6% |
| New Zealanders | 98.4 /100 | #100 | Exceptional 8.6% |
| Immigrants | Pakistan | 98.4 /100 | #101 | Exceptional 8.6% |
| Immigrants | South Africa | 98.3 /100 | #102 | Exceptional 8.6% |
| Scandinavians | 98.3 /100 | #103 | Exceptional 8.6% |
| Immigrants | France | 98.0 /100 | #104 | Exceptional 8.6% |
| Immigrants | Norway | 97.8 /100 | #105 | Exceptional 8.6% |
| Immigrants | Serbia | 97.7 /100 | #106 | Exceptional 8.6% |
| Chickasaw | 97.6 /100 | #107 | Exceptional 8.6% |
| Swedes | 97.6 /100 | #108 | Exceptional 8.6% |
| Immigrants | Romania | 97.5 /100 | #109 | Exceptional 8.6% |
| Latvians | 97.4 /100 | #110 | Exceptional 8.6% |
| Immigrants | Ukraine | 97.4 /100 | #111 | Exceptional 8.6% |