Zip Codes with the Highest Percentage of Population with a Degree in Liberal Arts and History in Morristown, TN
RELATED REPORTS & OPTIONS
Liberal Arts and History
Morristown
Compare Zip Codes
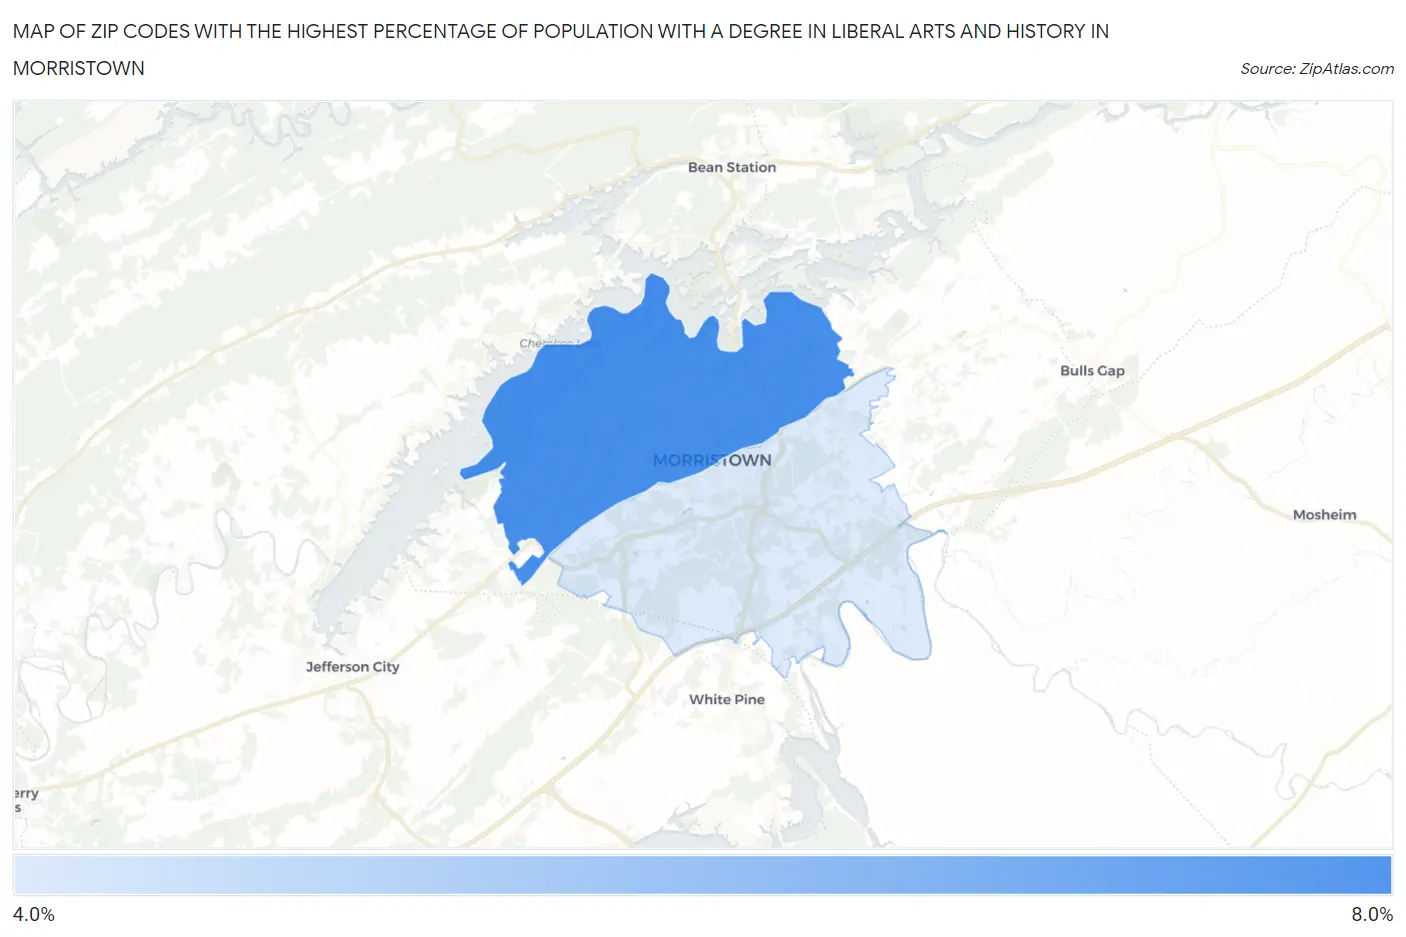
Map of Zip Codes with the Highest Percentage of Population with a Degree in Liberal Arts and History in Morristown
0.0%
8.0%
Zip Codes with the Highest Percentage of Population with a Degree in Liberal Arts and History in Morristown, TN
| Zip Code | % Graduates | vs State | vs National | |
| 1. | 37814 | 6.5% | 4.9%(+1.62)#149 | 4.9%(+1.62)#7,343 |
| 2. | 37813 | 5.0% | 4.9%(+0.098)#231 | 4.9%(+0.105)#11,414 |
1
Common Questions
What are the Top Zip Codes with the Highest Percentage of Population with a Degree in Liberal Arts and History in Morristown, TN?
Top Zip Codes with the Highest Percentage of Population with a Degree in Liberal Arts and History in Morristown, TN are:
What zip code has the Highest Percentage of Population with a Degree in Liberal Arts and History in Morristown, TN?
37814 has the Highest Percentage of Population with a Degree in Liberal Arts and History in Morristown, TN with 6.5%.
What is the Percentage of Population with a Degree in Liberal Arts and History in Morristown, TN?
Percentage of Population with a Degree in Liberal Arts and History in Morristown is 2.5%.
What is the Percentage of Population with a Degree in Liberal Arts and History in Tennessee?
Percentage of Population with a Degree in Liberal Arts and History in Tennessee is 4.9%.
What is the Percentage of Population with a Degree in Liberal Arts and History in the United States?
Percentage of Population with a Degree in Liberal Arts and History in the United States is 4.9%.