Zip Codes with the Highest Percentage of Households with Income Above $100,000 in Lebanon, TN
RELATED REPORTS & OPTIONS
Household Income | $100k+
Lebanon
Compare Zip Codes
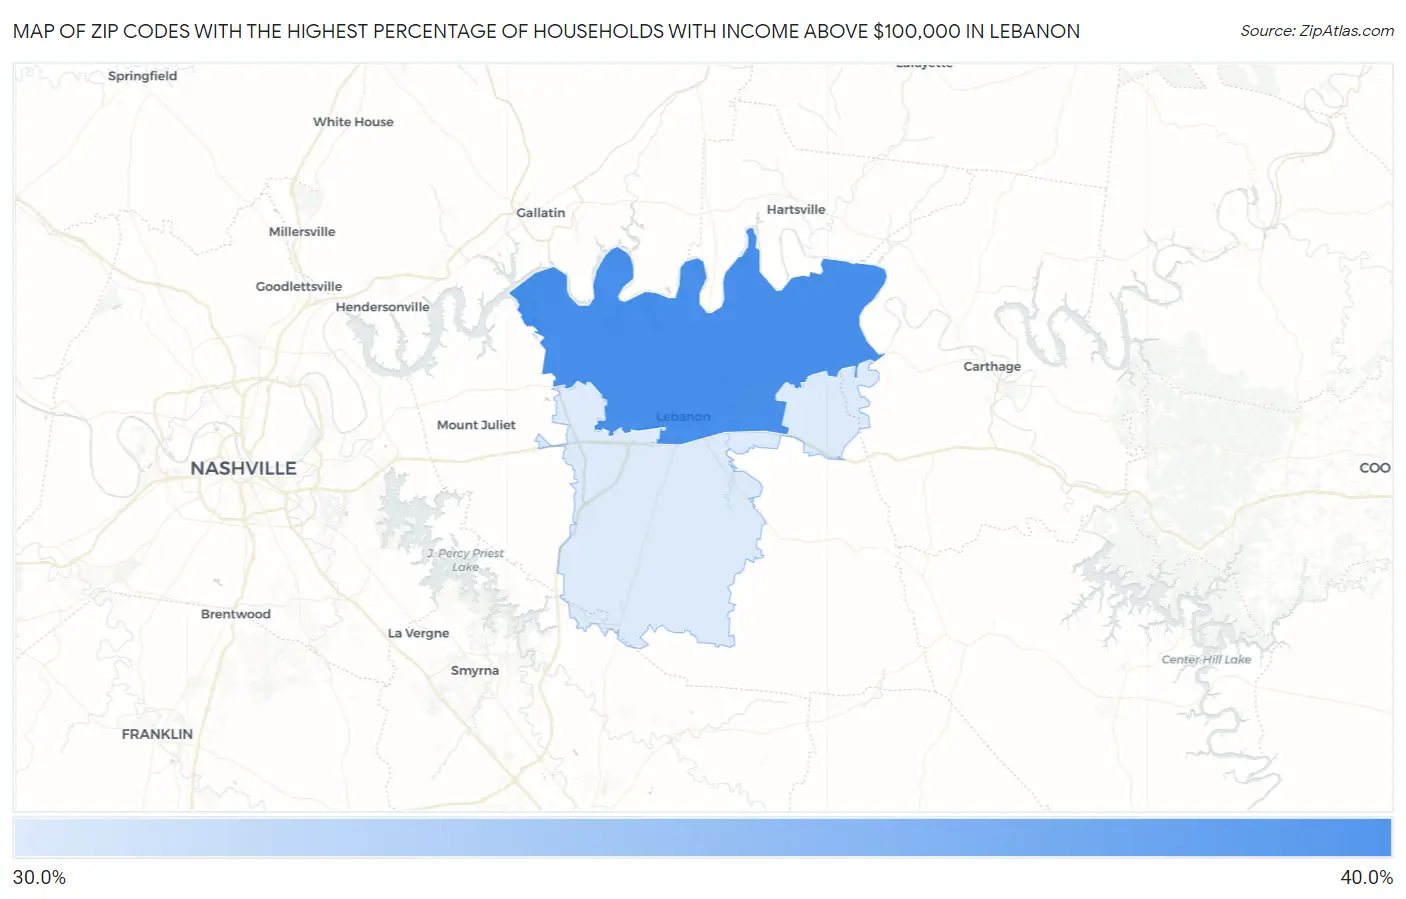
Map of Zip Codes with the Highest Percentage of Households with Income Above $100,000 in Lebanon
0.0%
40.0%
Zip Codes with the Highest Percentage of Households with Income Above $100,000 in Lebanon, TN
| Zip Code | Households with Income > $100k | vs State | vs National | |
| 1. | 37087 | 38.9% | 29.7%(+9.20)#84 | 37.3%(+1.60)#9,461 |
| 2. | 37090 | 36.6% | 29.7%(+6.90)#104 | 37.3%(-0.700)#10,819 |
1
Common Questions
What are the Top Zip Codes with the Highest Percentage of Households with Income Above $100,000 in Lebanon, TN?
Top Zip Codes with the Highest Percentage of Households with Income Above $100,000 in Lebanon, TN are:
What zip code has the Highest Percentage of Households with Income Above $100,000 in Lebanon, TN?
37087 has the Highest Percentage of Households with Income Above $100,000 in Lebanon, TN with 38.9%.
What is the Percentage of Households with Income Above $100,000 in Lebanon, TN?
Percentage of Households with Income Above $100,000 in Lebanon is 31.8%.
What is the Percentage of Households with Income Above $100,000 in Tennessee?
Percentage of Households with Income Above $100,000 in Tennessee is 29.7%.
What is the Percentage of Households with Income Above $100,000 in the United States?
Percentage of Households with Income Above $100,000 in the United States is 37.3%.