Zip Codes with the Highest Percentage of Population Employed in Life, Physical & Social Science in Lebanon, TN
RELATED REPORTS & OPTIONS
Life, Physical & Social Science
Lebanon
Compare Zip Codes
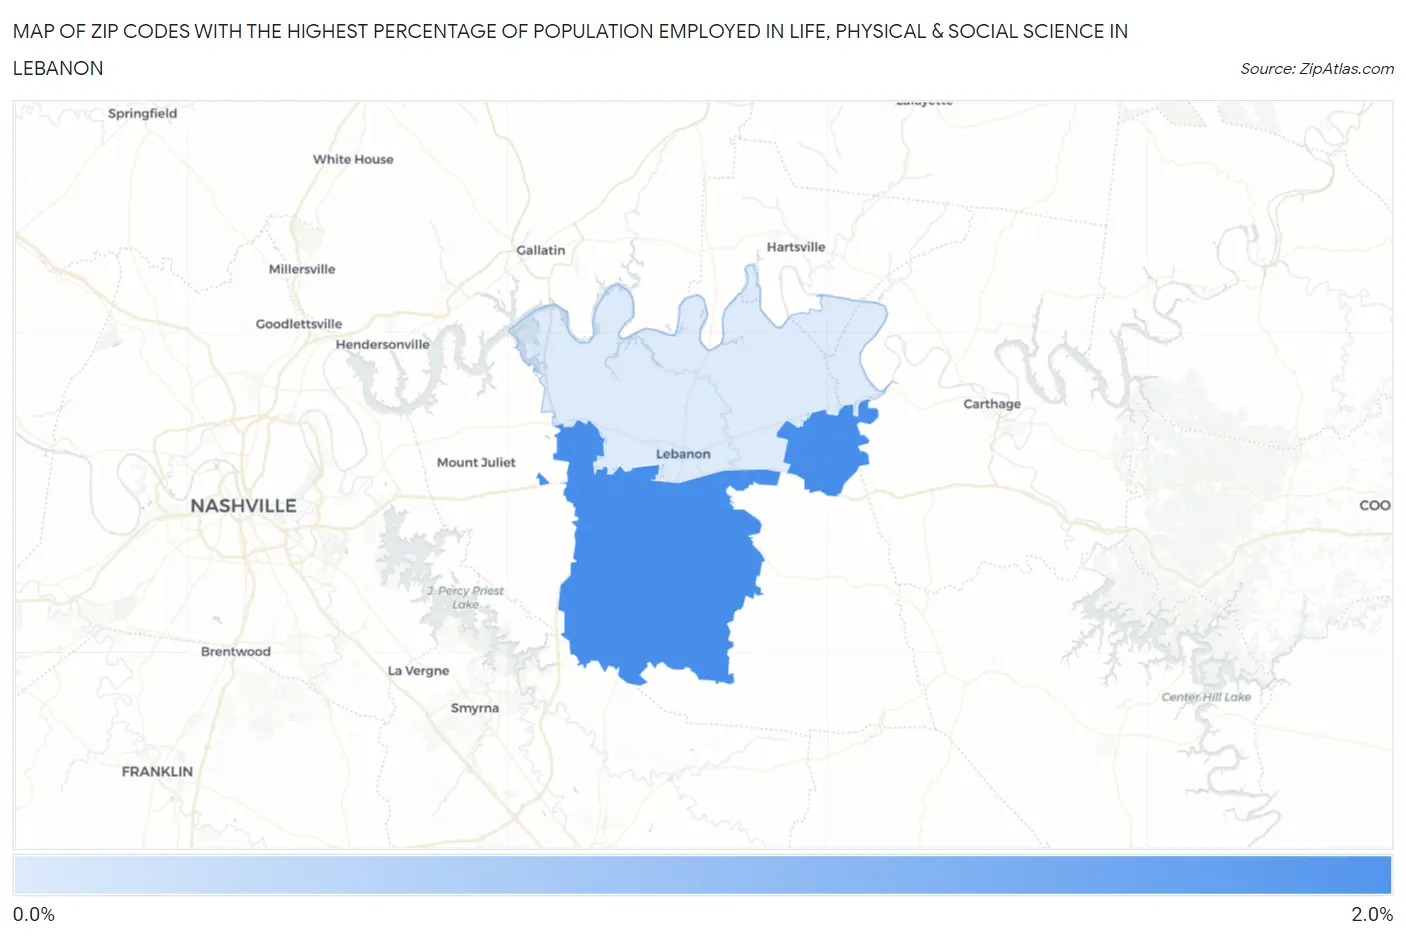
Map of Zip Codes with the Highest Percentage of Population Employed in Life, Physical & Social Science in Lebanon
0.0%
2.0%
Zip Codes with the Highest Percentage of Population Employed in Life, Physical & Social Science in Lebanon, TN
| Zip Code | % Employed | vs State | vs National | |
| 1. | 37090 | 1.9% | 0.83%(+1.08)#58 | 1.1%(+0.819)#3,943 |
| 2. | 37087 | 0.45% | 0.83%(-0.384)#258 | 1.1%(-0.644)#15,179 |
1
Common Questions
What are the Top Zip Codes with the Highest Percentage of Population Employed in Life, Physical & Social Science in Lebanon, TN?
Top Zip Codes with the Highest Percentage of Population Employed in Life, Physical & Social Science in Lebanon, TN are:
What zip code has the Highest Percentage of Population Employed in Life, Physical & Social Science in Lebanon, TN?
37090 has the Highest Percentage of Population Employed in Life, Physical & Social Science in Lebanon, TN with 1.9%.
What is the Percentage of Population Employed in Life, Physical & Social Science in Lebanon, TN?
Percentage of Population Employed in Life, Physical & Social Science in Lebanon is 0.75%.
What is the Percentage of Population Employed in Life, Physical & Social Science in Tennessee?
Percentage of Population Employed in Life, Physical & Social Science in Tennessee is 0.83%.
What is the Percentage of Population Employed in Life, Physical & Social Science in the United States?
Percentage of Population Employed in Life, Physical & Social Science in the United States is 1.1%.