Zip Codes with the Highest Percentage of Population Employed in Agriculture, Fishing & Hunting in Franklin, TN
RELATED REPORTS & OPTIONS
Agriculture, Fishing & Hunting
Franklin
Compare Zip Codes
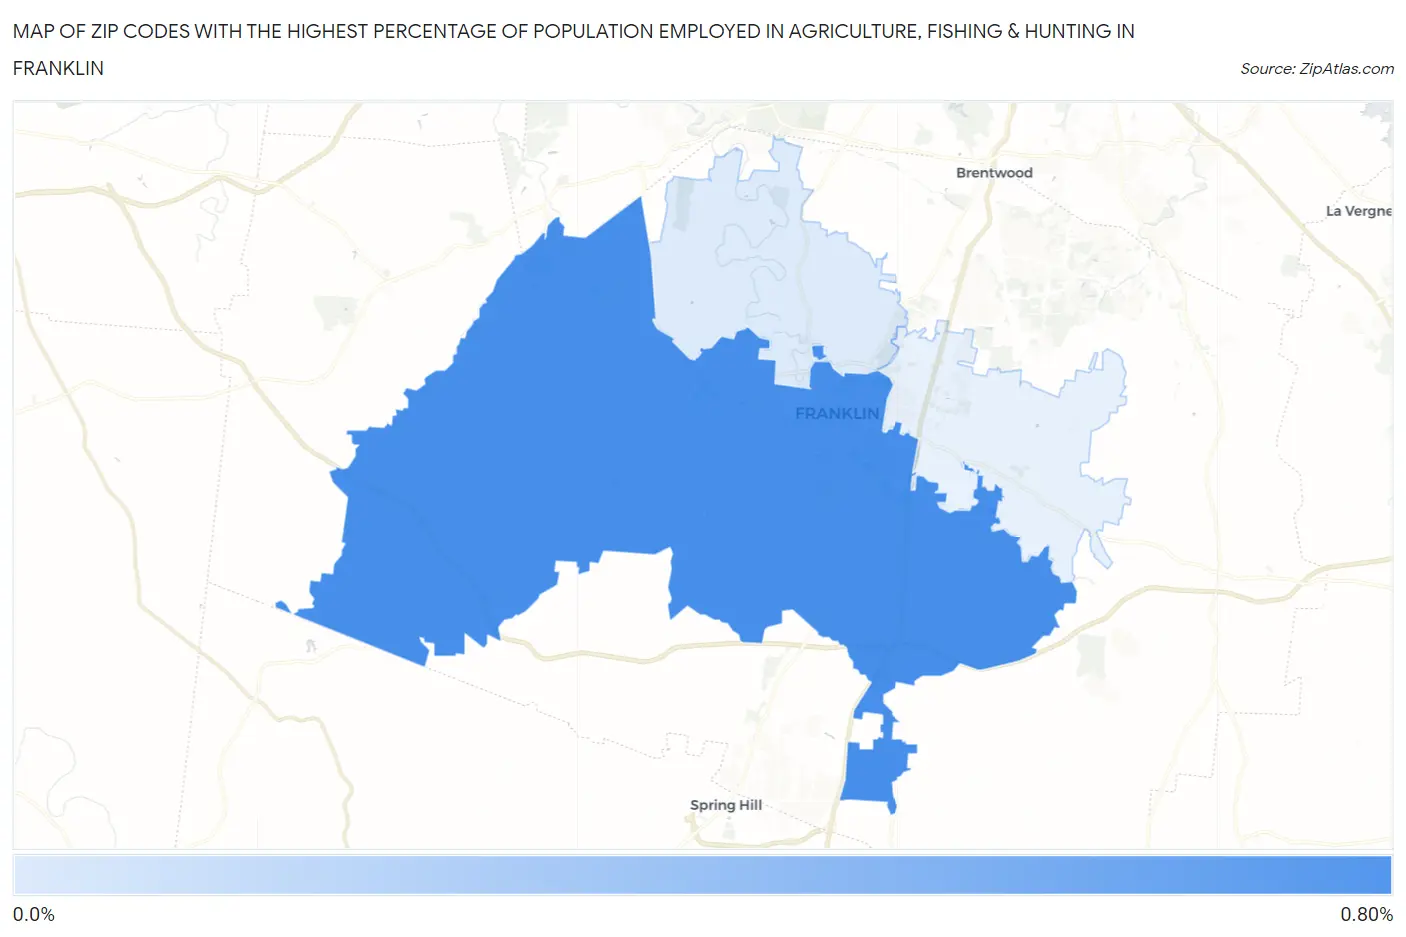
Map of Zip Codes with the Highest Percentage of Population Employed in Agriculture, Fishing & Hunting in Franklin
0.0%
0.80%
Zip Codes with the Highest Percentage of Population Employed in Agriculture, Fishing & Hunting in Franklin, TN
| Zip Code | % Employed | vs State | vs National | |
| 1. | 37064 | 0.67% | 0.74%(-0.062)#297 | 1.2%(-0.525)#17,994 |
| 2. | 37069 | 0.12% | 0.74%(-0.617)#437 | 1.2%(-1.08)#23,414 |
1
Common Questions
What are the Top Zip Codes with the Highest Percentage of Population Employed in Agriculture, Fishing & Hunting in Franklin, TN?
Top Zip Codes with the Highest Percentage of Population Employed in Agriculture, Fishing & Hunting in Franklin, TN are:
What zip code has the Highest Percentage of Population Employed in Agriculture, Fishing & Hunting in Franklin, TN?
37064 has the Highest Percentage of Population Employed in Agriculture, Fishing & Hunting in Franklin, TN with 0.67%.
What is the Percentage of Population Employed in Agriculture, Fishing & Hunting in Franklin, TN?
Percentage of Population Employed in Agriculture, Fishing & Hunting in Franklin is 0.13%.
What is the Percentage of Population Employed in Agriculture, Fishing & Hunting in Tennessee?
Percentage of Population Employed in Agriculture, Fishing & Hunting in Tennessee is 0.74%.
What is the Percentage of Population Employed in Agriculture, Fishing & Hunting in the United States?
Percentage of Population Employed in Agriculture, Fishing & Hunting in the United States is 1.2%.