Zip Codes with the Highest Percentage of Population Employed in Agriculture, Fishing & Hunting in Johnson City, TN
RELATED REPORTS & OPTIONS
Agriculture, Fishing & Hunting
Johnson City
Compare Zip Codes
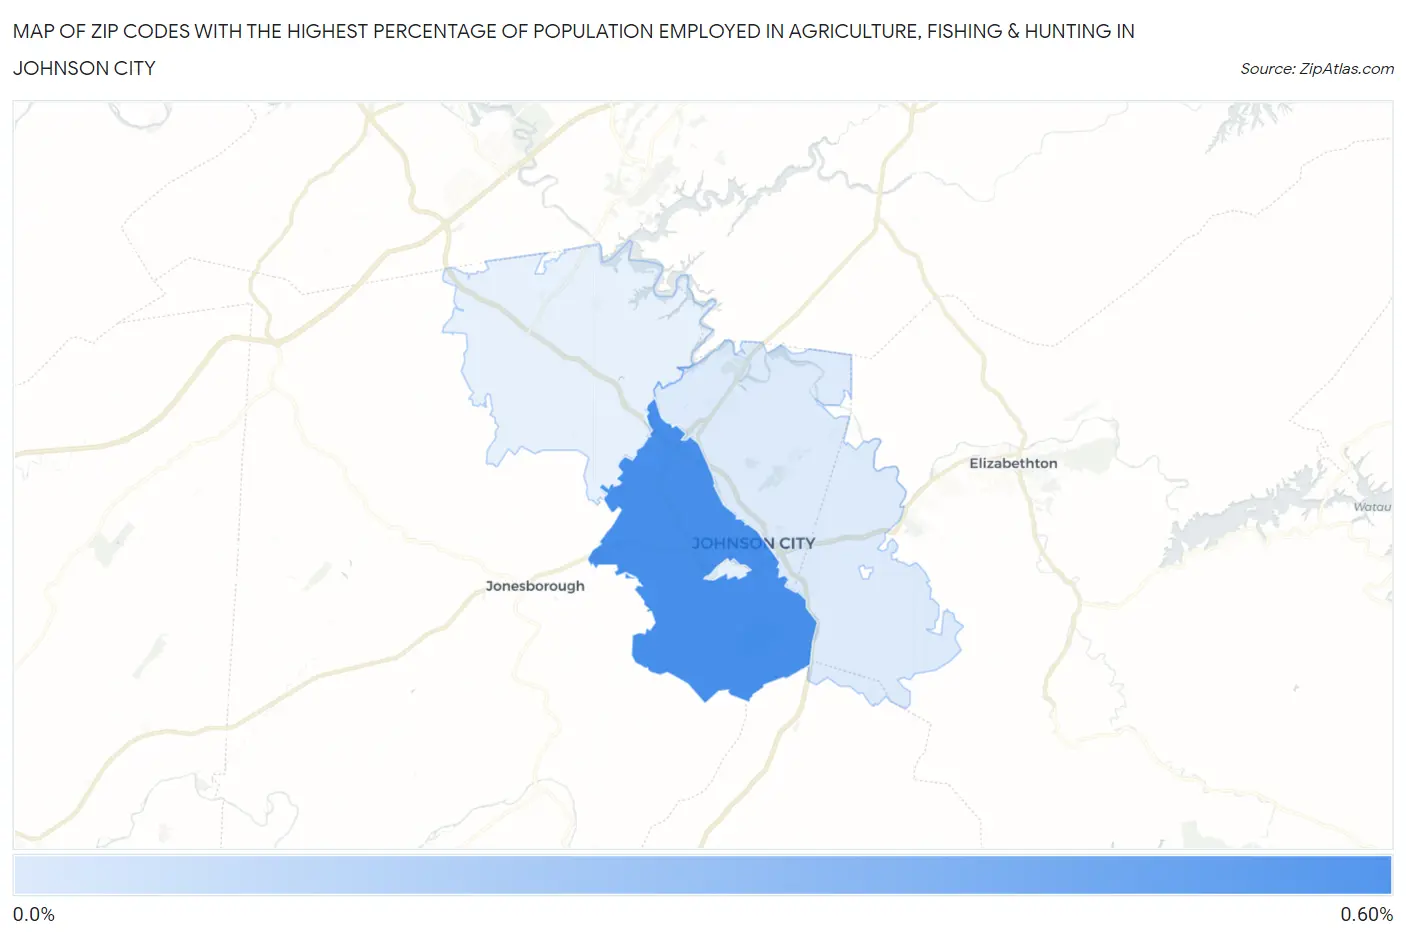
Map of Zip Codes with the Highest Percentage of Population Employed in Agriculture, Fishing & Hunting in Johnson City
0.0%
0.60%
Zip Codes with the Highest Percentage of Population Employed in Agriculture, Fishing & Hunting in Johnson City, TN
| Zip Code | % Employed | vs State | vs National | |
| 1. | 37604 | 0.51% | 0.74%(-0.222)#322 | 1.2%(-0.685)#19,147 |
| 2. | 37601 | 0.063% | 0.74%(-0.674)#457 | 1.2%(-1.14)#24,194 |
1
Common Questions
What are the Top 3 Zip Codes with the Highest Percentage of Population Employed in Agriculture, Fishing & Hunting in Johnson City, TN?
Top 3 Zip Codes with the Highest Percentage of Population Employed in Agriculture, Fishing & Hunting in Johnson City, TN are:
What zip code has the Highest Percentage of Population Employed in Agriculture, Fishing & Hunting in Johnson City, TN?
37604 has the Highest Percentage of Population Employed in Agriculture, Fishing & Hunting in Johnson City, TN with 0.51%.
What is the Percentage of Population Employed in Agriculture, Fishing & Hunting in Johnson City, TN?
Percentage of Population Employed in Agriculture, Fishing & Hunting in Johnson City is 0.13%.
What is the Percentage of Population Employed in Agriculture, Fishing & Hunting in Tennessee?
Percentage of Population Employed in Agriculture, Fishing & Hunting in Tennessee is 0.74%.
What is the Percentage of Population Employed in Agriculture, Fishing & Hunting in the United States?
Percentage of Population Employed in Agriculture, Fishing & Hunting in the United States is 1.2%.