Zip Codes with the Highest Percentage of Households with Income Above $100,000 in Cranston, RI
RELATED REPORTS & OPTIONS
Household Income | $100k+
Cranston
Compare Zip Codes
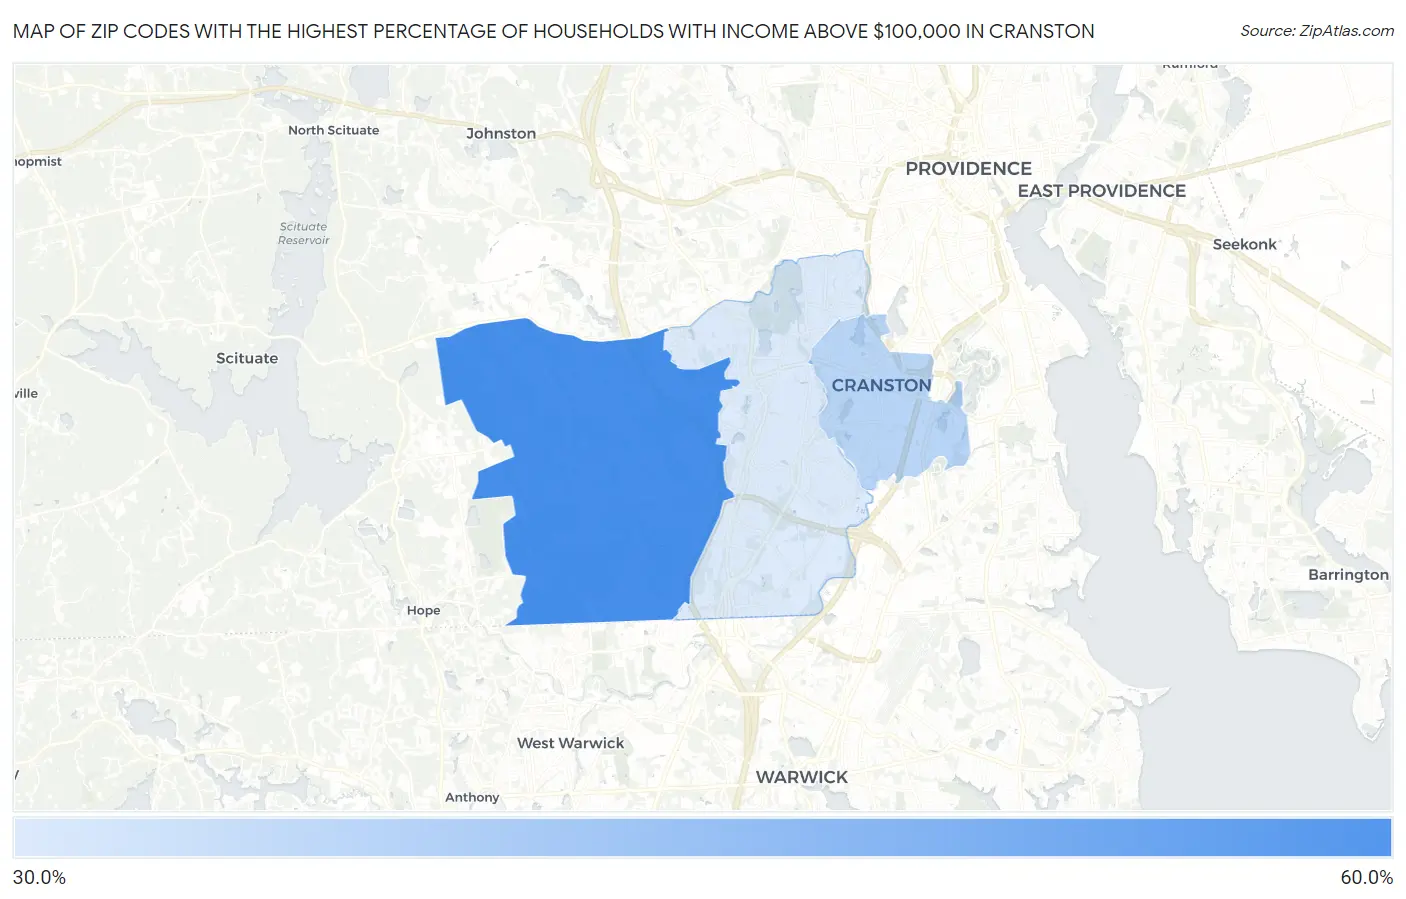
Map of Zip Codes with the Highest Percentage of Households with Income Above $100,000 in Cranston
0.0%
60.0%
Zip Codes with the Highest Percentage of Households with Income Above $100,000 in Cranston, RI
| Zip Code | Households with Income > $100k | vs State | vs National | |
| 1. | 02921 | 59.0% | 40.5%(+18.5)#11 | 37.3%(+21.7)#2,566 |
| 2. | 02910 | 41.1% | 40.5%(+0.600)#46 | 37.3%(+3.80)#8,338 |
| 3. | 02920 | 36.0% | 40.5%(-4.50)#55 | 37.3%(-1.30)#11,122 |
1
Common Questions
What are the Top Zip Codes with the Highest Percentage of Households with Income Above $100,000 in Cranston, RI?
Top Zip Codes with the Highest Percentage of Households with Income Above $100,000 in Cranston, RI are:
What zip code has the Highest Percentage of Households with Income Above $100,000 in Cranston, RI?
02921 has the Highest Percentage of Households with Income Above $100,000 in Cranston, RI with 59.0%.
What is the Percentage of Households with Income Above $100,000 in Cranston, RI?
Percentage of Households with Income Above $100,000 in Cranston is 41.3%.
What is the Percentage of Households with Income Above $100,000 in Rhode Island?
Percentage of Households with Income Above $100,000 in Rhode Island is 40.5%.
What is the Percentage of Households with Income Above $100,000 in the United States?
Percentage of Households with Income Above $100,000 in the United States is 37.3%.