Zip Codes with the Highest Percentage of Population Taking Taxi / Cab to Work in Cranston, RI
RELATED REPORTS & OPTIONS
Taxi / Cab
Cranston
Compare Zip Codes
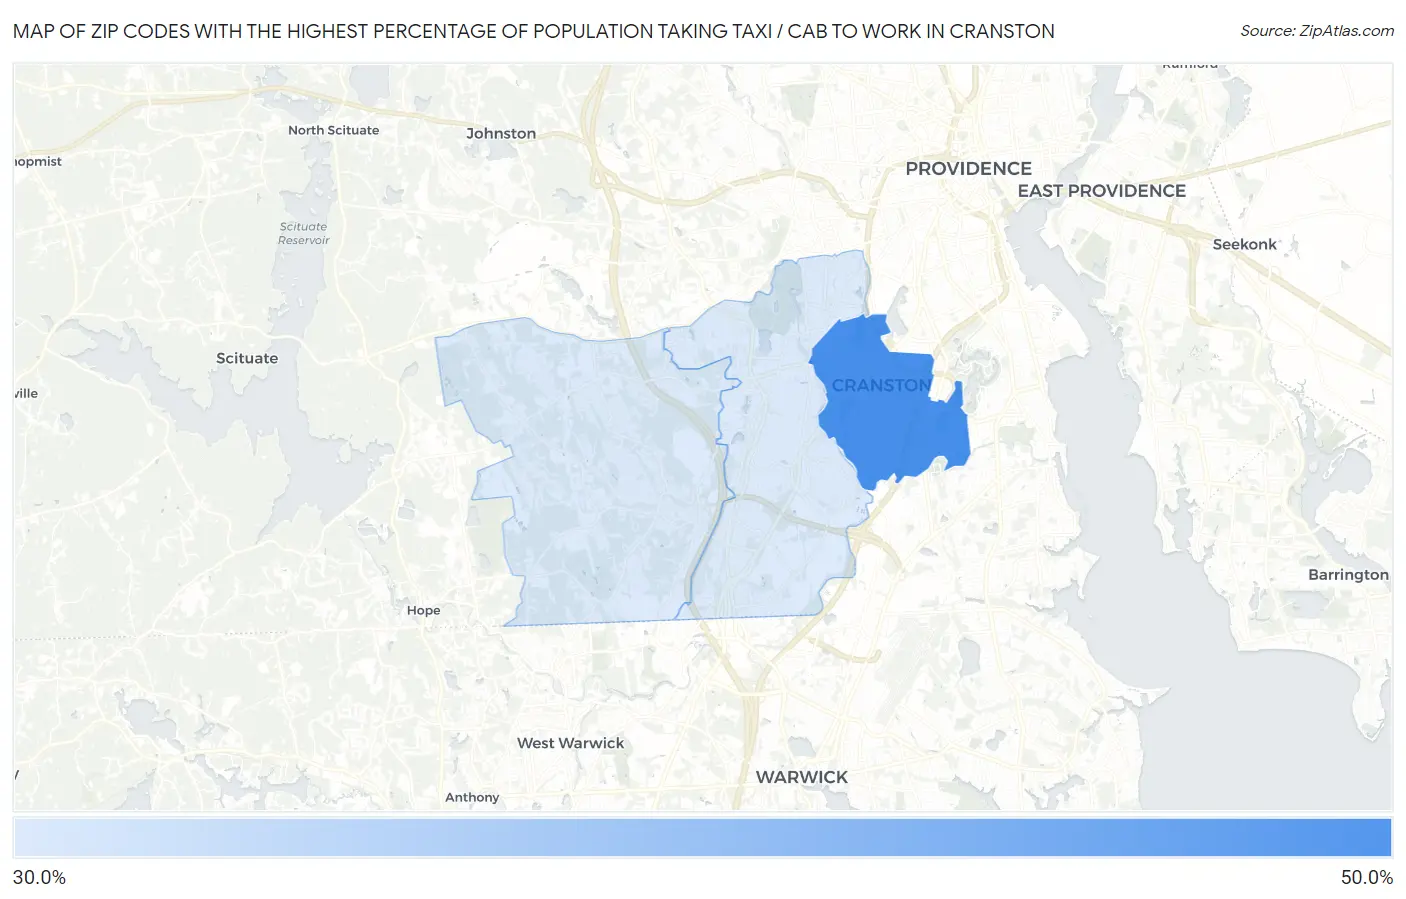
Map of Zip Codes with the Highest Percentage of Population Taking Taxi / Cab to Work in Cranston
0.0%
50.0%
Zip Codes with the Highest Percentage of Population Taking Taxi / Cab to Work in Cranston, RI
| Zip Code | % Take Taxi / Cab | vs State | vs National | |
| 1. | 02910 | 40.7% | 37.4%(+3.30)#17 | 38.2%(+2.50)#6,291 |
| 2. | 02920 | 39.3% | 37.4%(+1.90)#19 | 38.2%(+1.10)#6,930 |
| 3. | 02921 | 39.3% | 37.4%(+1.90)#20 | 38.2%(+1.10)#6,949 |
1
Common Questions
What are the Top Zip Codes with the Highest Percentage of Population Taking Taxi / Cab to Work in Cranston, RI?
Top Zip Codes with the Highest Percentage of Population Taking Taxi / Cab to Work in Cranston, RI are:
What zip code has the Highest Percentage of Population Taking Taxi / Cab to Work in Cranston, RI?
02910 has the Highest Percentage of Population Taking Taxi / Cab to Work in Cranston, RI with 40.7%.
What is the Percentage of Population Taking Taxi / Cab to Work in Cranston, RI?
Percentage of Population Taking Taxi / Cab to Work in Cranston is 39.3%.
What is the Percentage of Population Taking Taxi / Cab to Work in Rhode Island?
Percentage of Population Taking Taxi / Cab to Work in Rhode Island is 37.4%.
What is the Percentage of Population Taking Taxi / Cab to Work in the United States?
Percentage of Population Taking Taxi / Cab to Work in the United States is 38.2%.