Zip Codes with the Highest Percentage of Population Employed in Computer & Mathematics in Cranston, RI
RELATED REPORTS & OPTIONS
Computer & Mathematics
Cranston
Compare Zip Codes
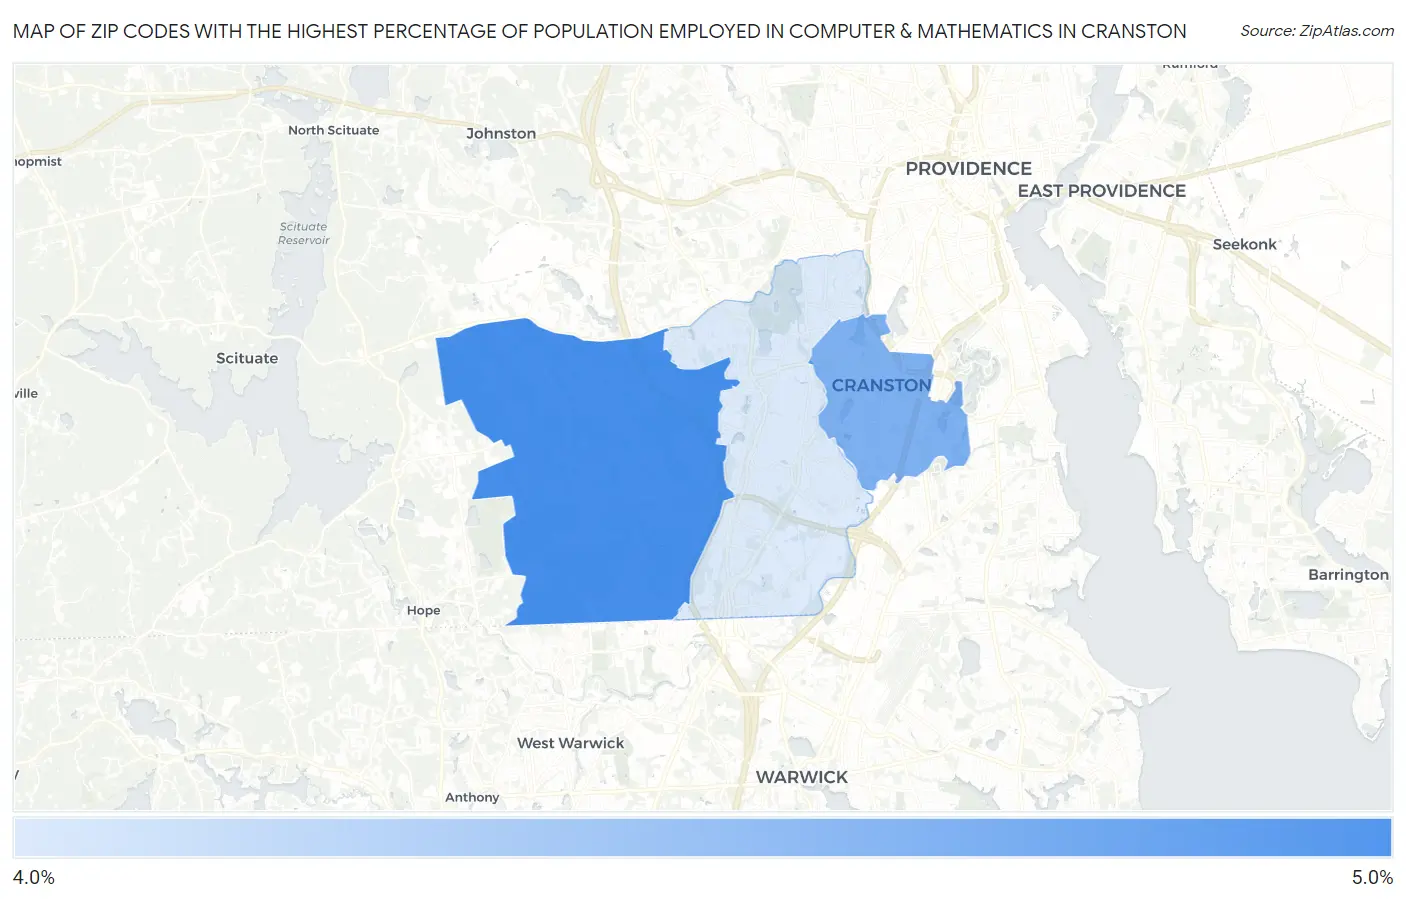
Map of Zip Codes with the Highest Percentage of Population Employed in Computer & Mathematics in Cranston
0.0%
5.0%
Zip Codes with the Highest Percentage of Population Employed in Computer & Mathematics in Cranston, RI
| Zip Code | % Employed | vs State | vs National | |
| 1. | 02921 | 4.3% | 3.2%(+1.14)#14 | 3.5%(+0.801)#4,384 |
| 2. | 02910 | 4.3% | 3.2%(+1.07)#16 | 3.5%(+0.735)#4,496 |
| 3. | 02920 | 4.1% | 3.2%(+0.962)#19 | 3.5%(+0.624)#4,709 |
1
Common Questions
What are the Top Zip Codes with the Highest Percentage of Population Employed in Computer & Mathematics in Cranston, RI?
Top Zip Codes with the Highest Percentage of Population Employed in Computer & Mathematics in Cranston, RI are:
What zip code has the Highest Percentage of Population Employed in Computer & Mathematics in Cranston, RI?
02921 has the Highest Percentage of Population Employed in Computer & Mathematics in Cranston, RI with 4.3%.
What is the Percentage of Population Employed in Computer & Mathematics in Cranston, RI?
Percentage of Population Employed in Computer & Mathematics in Cranston is 4.1%.
What is the Percentage of Population Employed in Computer & Mathematics in Rhode Island?
Percentage of Population Employed in Computer & Mathematics in Rhode Island is 3.2%.
What is the Percentage of Population Employed in Computer & Mathematics in the United States?
Percentage of Population Employed in Computer & Mathematics in the United States is 3.5%.