Immigrants from Taiwan vs Basque Married-Couple Family Poverty

COMPARE

Immigrants from Taiwan
Race
Ancestry
AfghanAfricanAlaska NativeAlaskan AthabascanAlbanianAleutAlsatianAmericanApacheArabArapahoArgentineanArmenianAssyrian/Chaldean/SyriacAustralianAustrianBahamianBangladeshiBarbadianBelgianBelizeanBermudanBhutaneseBlackfeetBolivianBrazilianBritishBritish West IndianBulgarianBurmeseCajunCambodianCanadianCape VerdeanCarpatho RusynCelticCentral AmericanCentral American IndianCherokeeCheyenneChickasawChileanChineseChippewaChoctawColombianColvilleComancheCosta RicanCreeCreekCroatianCrowCubanCypriotCzechCzechoslovakianDanishDelawareDominicanDutchDutch West IndianEastern EuropeanEcuadorianEgyptianEnglishEstonianEthiopianEuropeanFijianFilipinoFinnishFrenchFrench American IndianFrench CanadianGermanGerman RussianGhanaianGreekGuamanian/ChamorroGuatemalanGuyaneseHaitianHmongHonduranHopiHoumaHungarianIcelanderIndian (Asian)IndonesianInupiatIranianIraqiIrishIroquoisIsraeliItalianJamaicanJapaneseJordanianKenyanKiowaKoreanLaotianLatvianLebaneseLiberianLithuanianLumbeeLuxembourgerMacedonianMalaysianMalteseMarshalleseMenomineeMexicanMexican American IndianMongolianMoroccanNative HawaiianNavajoNepaleseNew ZealanderNicaraguanNigerianNorthern EuropeanNorwegianOkinawanOsageOttawaPaiutePakistaniPalestinianPanamanianParaguayanPennsylvania GermanPeruvianPimaPolishPortuguesePotawatomiPuebloPuerto RicanPuget Sound SalishRomanianRussianSalvadoranSamoanScandinavianScotch-IrishScottishSeminoleSenegaleseSerbianShoshoneSierra LeoneanSiouxSlavicSlovakSloveneSomaliSouth AfricanSouth AmericanSouth American IndianSoviet UnionSpaniardSpanishSpanish AmericanSpanish American IndianSri LankanSubsaharan AfricanSudaneseSwedishSwissSyrianTaiwaneseThaiTlingit-HaidaTohono O'OdhamTonganTrinidadian and TobagonianTsimshianTurkishU.S. Virgin IslanderUgandanUkrainianUruguayanUteVenezuelanVietnameseWelshWest IndianYakamaYaquiYugoslavianYumanYup'ikZimbabwean
Immigration
NonimmigrantsImmigrantsAfghanistanAfricaAlbaniaArgentinaArmeniaAsiaAustraliaAustriaBahamasBangladeshBarbadosBelarusBelgiumBelizeBoliviaBosnia and HerzegovinaBrazilBulgariaBurma/MyanmarCabo VerdeCambodiaCameroonCanadaCaribbeanCentral AmericaChileChinaColombiaCongoCosta RicaCroatiaCubaCzechoslovakiaDenmarkDominicaDominican RepublicEastern AfricaEastern AsiaEastern EuropeEcuadorEgyptEl SalvadorEnglandEritreaEthiopiaEuropeFijiFranceGermanyGhanaGreeceGrenadaGuatemalaGuyanaHaitiHondurasHong KongHungaryIndiaIndonesiaIranIraqIrelandIsraelItalyJamaicaJapanJordanKazakhstanKenyaKoreaKuwaitLaosLatin AmericaLatviaLebanonLiberiaLithuaniaMalaysiaMexicoMicronesiaMiddle AfricaMoldovaMoroccoNepalNetherlandsNicaraguaNigeriaNorth AmericaNorth MacedoniaNorthern AfricaNorthern EuropeNorwayOceaniaPakistanPanamaPeruPhilippinesPolandPortugalRomaniaRussiaSaudi ArabiaScotlandSenegalSerbiaSierra LeoneSingaporeSomaliaSouth AfricaSouth AmericaSouth Central AsiaSouth Eastern AsiaSouthern EuropeSpainSri LankaSt. Vincent and the GrenadinesSudanSwedenSwitzerlandSyriaTaiwanThailandTrinidad and TobagoTurkeyUgandaUkraineUruguayUzbekistanVenezuelaVietnamWest IndiesWestern AfricaWestern AsiaWestern EuropeYemenZaireZimbabweAzores
Basque
Race
Ancestry
AfghanAfricanAlaska NativeAlaskan AthabascanAlbanianAleutAlsatianAmericanApacheArabArapahoArgentineanArmenianAssyrian/Chaldean/SyriacAustralianAustrianBahamianBangladeshiBarbadianBasqueBelgianBelizeanBermudanBhutaneseBlackfeetBolivianBrazilianBritishBritish West IndianBulgarianBurmeseCajunCambodianCanadianCape VerdeanCarpatho RusynCelticCentral AmericanCentral American IndianCherokeeCheyenneChickasawChileanChineseChippewaChoctawColombianColvilleComancheCosta RicanCreeCreekCroatianCrowCubanCypriotCzechCzechoslovakianDanishDelawareDominicanDutchDutch West IndianEastern EuropeanEcuadorianEgyptianEnglishEstonianEthiopianEuropeanFijianFilipinoFinnishFrenchFrench American IndianFrench CanadianGermanGerman RussianGhanaianGreekGuamanian/ChamorroGuatemalanGuyaneseHaitianHmongHonduranHopiHoumaHungarianIcelanderIndian (Asian)IndonesianInupiatIranianIraqiIrishIroquoisIsraeliItalianJamaicanJapaneseJordanianKenyanKiowaKoreanLaotianLatvianLebaneseLiberianLithuanianLumbeeLuxembourgerMacedonianMalaysianMalteseMarshalleseMenomineeMexicanMexican American IndianMongolianMoroccanNative HawaiianNavajoNepaleseNew ZealanderNicaraguanNigerianNorthern EuropeanNorwegianOkinawanOsageOttawaPaiutePakistaniPalestinianPanamanianParaguayanPennsylvania GermanPeruvianPimaPolishPortuguesePotawatomiPuebloPuerto RicanPuget Sound SalishRomanianRussianSalvadoranSamoanScandinavianScotch-IrishScottishSeminoleSenegaleseSerbianShoshoneSierra LeoneanSiouxSlavicSlovakSloveneSomaliSouth AfricanSouth AmericanSouth American IndianSoviet UnionSpaniardSpanishSpanish AmericanSpanish American IndianSri LankanSubsaharan AfricanSudaneseSwedishSwissSyrianTaiwaneseThaiTlingit-HaidaTohono O'OdhamTonganTrinidadian and TobagonianTsimshianTurkishU.S. Virgin IslanderUgandanUkrainianUruguayanUteVenezuelanVietnameseWelshWest IndianYakamaYaquiYugoslavianYumanYup'ikZimbabwean
Immigration
NonimmigrantsImmigrantsAfghanistanAfricaAlbaniaArgentinaArmeniaAsiaAustraliaAustriaBahamasBangladeshBarbadosBelarusBelgiumBelizeBoliviaBosnia and HerzegovinaBrazilBulgariaBurma/MyanmarCabo VerdeCambodiaCameroonCanadaCaribbeanCentral AmericaChileChinaColombiaCongoCosta RicaCroatiaCubaCzechoslovakiaDenmarkDominicaDominican RepublicEastern AfricaEastern AsiaEastern EuropeEcuadorEgyptEl SalvadorEnglandEritreaEthiopiaEuropeFijiFranceGermanyGhanaGreeceGrenadaGuatemalaGuyanaHaitiHondurasHong KongHungaryIndiaIndonesiaIranIraqIrelandIsraelItalyJamaicaJapanJordanKazakhstanKenyaKoreaKuwaitLaosLatin AmericaLatviaLebanonLiberiaLithuaniaMalaysiaMexicoMicronesiaMiddle AfricaMoldovaMoroccoNepalNetherlandsNicaraguaNigeriaNorth AmericaNorth MacedoniaNorthern AfricaNorthern EuropeNorwayOceaniaPakistanPanamaPeruPhilippinesPolandPortugalRomaniaRussiaSaudi ArabiaScotlandSenegalSerbiaSierra LeoneSingaporeSomaliaSouth AfricaSouth AmericaSouth Central AsiaSouth Eastern AsiaSouthern EuropeSpainSri LankaSt. Vincent and the GrenadinesSudanSwedenSwitzerlandSyriaThailandTrinidad and TobagoTurkeyUgandaUkraineUruguayUzbekistanVenezuelaVietnamWest IndiesWestern AfricaWestern AsiaWestern EuropeYemenZaireZimbabweAzores
Married-Couple Family Poverty
Income
Poverty
Unemployment
Labor Participation
Family Structure
Vehicle Availability
Education Level
Disability

Married-Couple Family Poverty Comparison

Immigrants from Taiwan

Basques

Exceptional
Exceptional
4.1%
MARRIED-COUPLE FAMILY POVERTY
99.9/ 100
METRIC RATING
25th/ 347
METRIC RANK
4.6%
MARRIED-COUPLE FAMILY POVERTY
98.5/ 100
METRIC RATING
91st/ 347
METRIC RANK

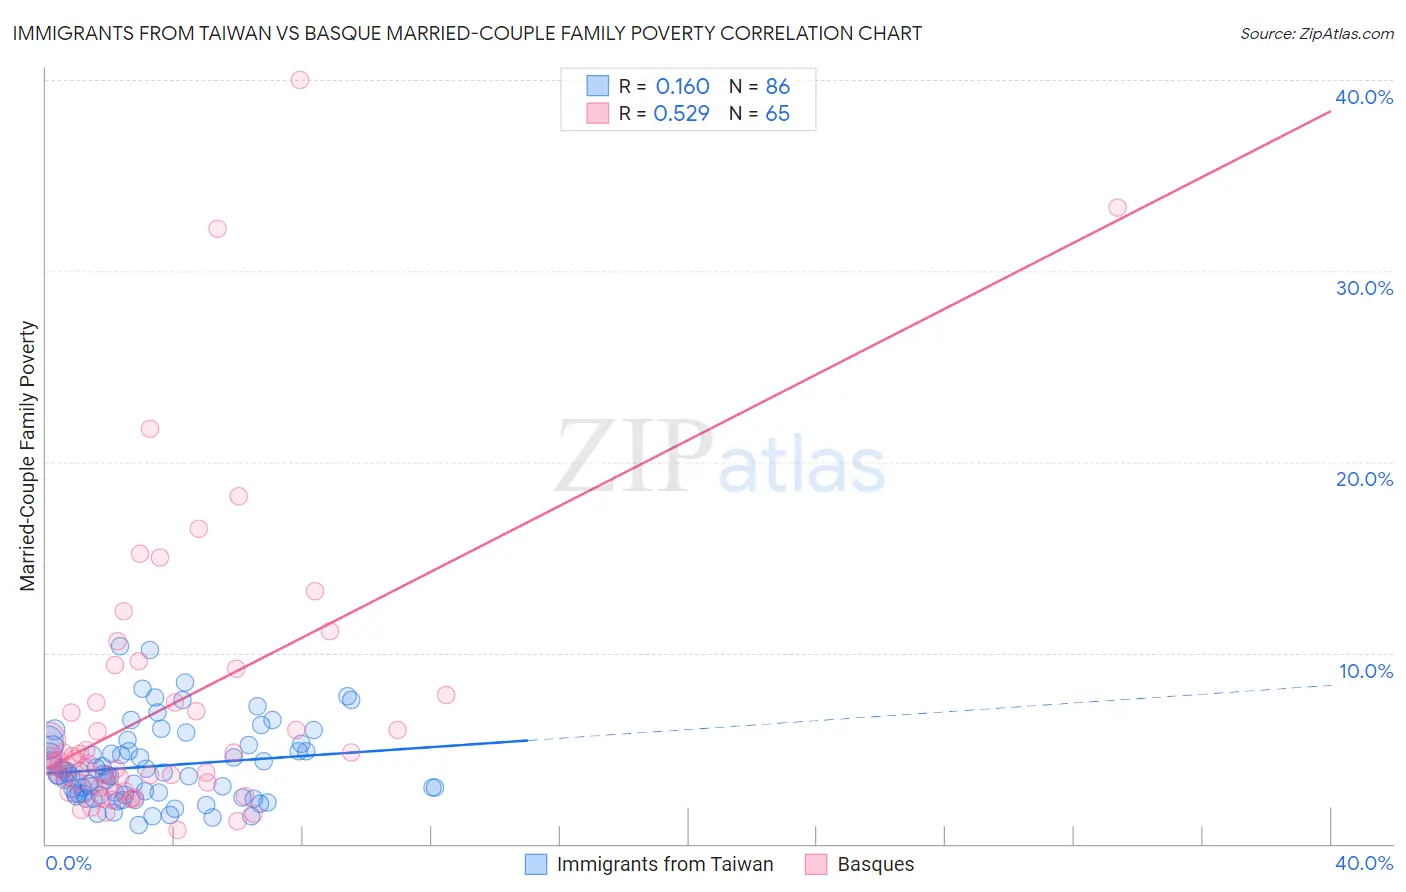
Immigrants from Taiwan vs Basque Married-Couple Family Poverty Correlation Chart

The statistical analysis conducted on geographies consisting of 295,998,361 people shows a poor positive correlation between the proportion of Immigrants from Taiwan and poverty level among married-couple families in the United States with a correlation coefficient (R) of 0.160 and weighted average of 4.1%. Similarly, the statistical analysis conducted on geographies consisting of 165,263,383 people shows a substantial positive correlation between the proportion of Basques and poverty level among married-couple families in the United States with a correlation coefficient (R) of 0.529 and weighted average of 4.6%, a difference of 11.1%.
Immigrants from Taiwan vs Basque Married-Couple Family Poverty

Married-Couple Family Poverty Correlation Summary

MeasurementImmigrants from TaiwanBasque
Minimum1.0%0.72%
Maximum10.3%40.0%
Range9.3%39.3%
Mean4.1%7.1%
Median3.6%4.4%
Interquartile 25% (IQ1)2.6%3.0%
Interquartile 75% (IQ3)5.1%7.6%
Interquartile Range (IQR)2.5%4.6%
Standard Deviation (Sample)2.0%7.6%
Standard Deviation (Population)2.0%7.6%

Similar Demographics by Married-Couple Family Poverty

Demographics Similar to Immigrants from Taiwan by Married-Couple Family Poverty

In terms of married-couple family poverty, the demographic groups most similar to Immigrants from Taiwan are Cypriot (4.1%, a difference of 0.27%), Danish (4.1%, a difference of 0.38%), Scandinavian (4.1%, a difference of 0.49%), Immigrants from Scotland (4.2%, a difference of 0.53%), and Eastern European (4.1%, a difference of 0.57%).
DemographicsRating | RankMarried-Couple Family Poverty
Italians
100.0
/100
|
#18
Exceptional
4.0%
Immigrants | Ireland
99.9
/100
|
#19
Exceptional
4.1%
Maltese
99.9
/100
|
#20
Exceptional
4.1%
Zimbabweans
99.9
/100
|
#21
Exceptional
4.1%
Immigrants | Singapore
99.9
/100
|
#22
Exceptional
4.1%
Bhutanese
99.9
/100
|
#23
Exceptional
4.1%
Eastern Europeans
99.9
/100
|
#24
Exceptional
4.1%
Immigrants | Taiwan
99.9
/100
|
#25
Exceptional
4.1%
Cypriots
99.9
/100
|
#26
Exceptional
4.1%
Danes
99.9
/100
|
#27
Exceptional
4.1%
Scandinavians
99.9
/100
|
#28
Exceptional
4.1%
Immigrants | Scotland
99.9
/100
|
#29
Exceptional
4.2%
Finns
99.9
/100
|
#30
Exceptional
4.2%
Estonians
99.9
/100
|
#31
Exceptional
4.2%
Greeks
99.9
/100
|
#32
Exceptional
4.2%

Demographics Similar to Basques by Married-Couple Family Poverty

In terms of married-couple family poverty, the demographic groups most similar to Basques are Immigrants from Switzerland (4.6%, a difference of 0.040%), Immigrants from Norway (4.6%, a difference of 0.080%), Immigrants from Czechoslovakia (4.6%, a difference of 0.11%), Bolivian (4.6%, a difference of 0.22%), and Korean (4.6%, a difference of 0.26%).
DemographicsRating | RankMarried-Couple Family Poverty
Immigrants | Croatia
98.7
/100
|
#84
Exceptional
4.6%
South Africans
98.7
/100
|
#85
Exceptional
4.6%
Immigrants | Turkey
98.6
/100
|
#86
Exceptional
4.6%
Immigrants | North Macedonia
98.6
/100
|
#87
Exceptional
4.6%
Bolivians
98.6
/100
|
#88
Exceptional
4.6%
Immigrants | Czechoslovakia
98.5
/100
|
#89
Exceptional
4.6%
Immigrants | Switzerland
98.5
/100
|
#90
Exceptional
4.6%
Basques
98.5
/100
|
#91
Exceptional
4.6%
Immigrants | Norway
98.4
/100
|
#92
Exceptional
4.6%
Koreans
98.3
/100
|
#93
Exceptional
4.6%
Immigrants | Italy
98.3
/100
|
#94
Exceptional
4.6%
Portuguese
98.3
/100
|
#95
Exceptional
4.6%
Immigrants | Poland
98.3
/100
|
#96
Exceptional
4.6%
Immigrants | Belgium
98.2
/100
|
#97
Exceptional
4.6%
Native Hawaiians
98.0
/100
|
#98
Exceptional
4.6%