Egyptian vs Sioux Receiving Food Stamps
COMPARE
Egyptian
Sioux
Receiving Food Stamps
Receiving Food Stamps Comparison
Egyptians
Sioux
10.0%
RECEIVING FOOD STAMPS
98.4/ 100
METRIC RATING
87th/ 347
METRIC RANK
16.8%
RECEIVING FOOD STAMPS
0.0/ 100
METRIC RATING
312th/ 347
METRIC RANK
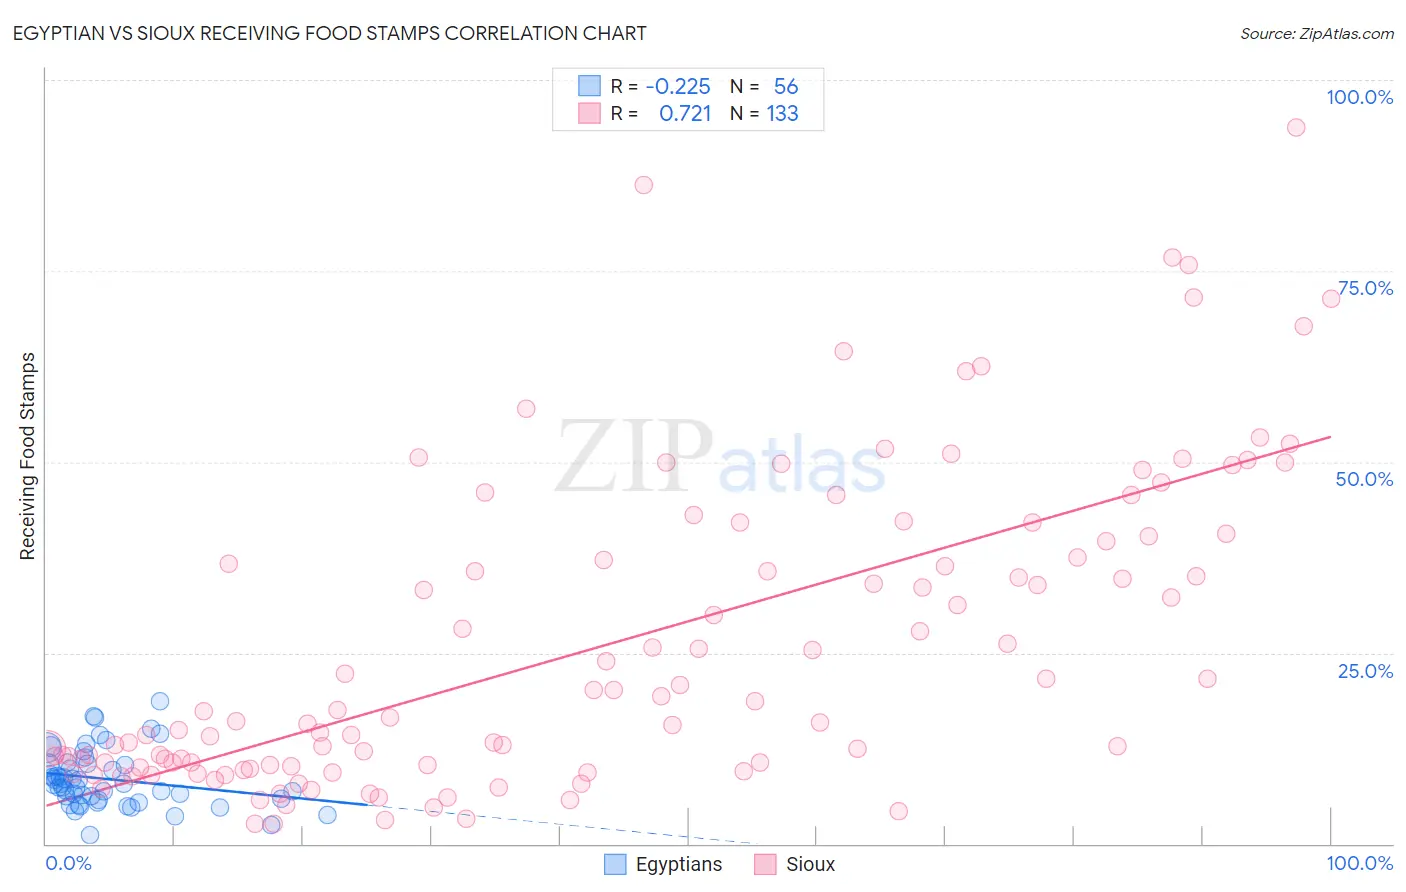
Egyptian vs Sioux Receiving Food Stamps Correlation Chart
The statistical analysis conducted on geographies consisting of 276,302,690 people shows a weak negative correlation between the proportion of Egyptians and percentage of population receiving government assistance and/or food stamps in the United States with a correlation coefficient (R) of -0.225 and weighted average of 10.0%. Similarly, the statistical analysis conducted on geographies consisting of 234,002,578 people shows a strong positive correlation between the proportion of Sioux and percentage of population receiving government assistance and/or food stamps in the United States with a correlation coefficient (R) of 0.721 and weighted average of 16.8%, a difference of 67.6%.
Receiving Food Stamps Correlation Summary
| Measurement | Egyptian | Sioux |
| Minimum | 1.1% | 2.6% |
| Maximum | 18.7% | 93.8% |
| Range | 17.6% | 91.2% |
| Mean | 8.5% | 26.1% |
| Median | 7.9% | 17.3% |
| Interquartile 25% (IQ1) | 5.9% | 10.3% |
| Interquartile 75% (IQ3) | 10.4% | 39.9% |
| Interquartile Range (IQR) | 4.5% | 29.7% |
| Standard Deviation (Sample) | 3.7% | 20.2% |
| Standard Deviation (Population) | 3.7% | 20.2% |
Similar Demographics by Receiving Food Stamps
Demographics Similar to Egyptians by Receiving Food Stamps
In terms of receiving food stamps, the demographic groups most similar to Egyptians are Immigrants from Norway (10.0%, a difference of 0.030%), Immigrants from Kuwait (10.0%, a difference of 0.060%), Immigrants from Romania (10.0%, a difference of 0.13%), Immigrants from Israel (10.0%, a difference of 0.31%), and Immigrants from France (10.1%, a difference of 0.31%).
| Demographics | Rating | Rank | Receiving Food Stamps |
| Poles | 98.6 /100 | #80 | Exceptional 10.0% |
| Immigrants | England | 98.6 /100 | #81 | Exceptional 10.0% |
| Austrians | 98.6 /100 | #82 | Exceptional 10.0% |
| Dutch | 98.6 /100 | #83 | Exceptional 10.0% |
| Immigrants | Israel | 98.5 /100 | #84 | Exceptional 10.0% |
| Immigrants | Romania | 98.5 /100 | #85 | Exceptional 10.0% |
| Immigrants | Norway | 98.4 /100 | #86 | Exceptional 10.0% |
| Egyptians | 98.4 /100 | #87 | Exceptional 10.0% |
| Immigrants | Kuwait | 98.4 /100 | #88 | Exceptional 10.0% |
| Immigrants | France | 98.3 /100 | #89 | Exceptional 10.1% |
| Finns | 97.9 /100 | #90 | Exceptional 10.2% |
| Jordanians | 97.9 /100 | #91 | Exceptional 10.2% |
| Irish | 97.9 /100 | #92 | Exceptional 10.2% |
| Belgians | 97.7 /100 | #93 | Exceptional 10.2% |
| Immigrants | Greece | 97.4 /100 | #94 | Exceptional 10.3% |
Demographics Similar to Sioux by Receiving Food Stamps
In terms of receiving food stamps, the demographic groups most similar to Sioux are Immigrants from Jamaica (16.9%, a difference of 0.28%), Immigrants from Guyana (16.9%, a difference of 0.45%), Guyanese (16.7%, a difference of 0.70%), Bahamian (17.0%, a difference of 1.0%), and Immigrants from Barbados (16.6%, a difference of 1.2%).
| Demographics | Rating | Rank | Receiving Food Stamps |
| Immigrants | Azores | 0.0 /100 | #305 | Tragic 16.4% |
| Jamaicans | 0.0 /100 | #306 | Tragic 16.4% |
| Houma | 0.0 /100 | #307 | Tragic 16.5% |
| Barbadians | 0.0 /100 | #308 | Tragic 16.5% |
| U.S. Virgin Islanders | 0.0 /100 | #309 | Tragic 16.5% |
| Immigrants | Barbados | 0.0 /100 | #310 | Tragic 16.6% |
| Guyanese | 0.0 /100 | #311 | Tragic 16.7% |
| Sioux | 0.0 /100 | #312 | Tragic 16.8% |
| Immigrants | Jamaica | 0.0 /100 | #313 | Tragic 16.9% |
| Immigrants | Guyana | 0.0 /100 | #314 | Tragic 16.9% |
| Bahamians | 0.0 /100 | #315 | Tragic 17.0% |
| Central American Indians | 0.0 /100 | #316 | Tragic 17.1% |
| Blacks/African Americans | 0.0 /100 | #317 | Tragic 17.2% |
| Menominee | 0.0 /100 | #318 | Tragic 17.2% |
| Immigrants | St. Vincent and the Grenadines | 0.0 /100 | #319 | Tragic 17.2% |