Australian vs Immigrants from Spain Female Poverty

COMPARE

Australian
Race
Ancestry
AfghanAfricanAlaska NativeAlaskan AthabascanAlbanianAleutAlsatianAmericanApacheArabArapahoArgentineanArmenianAssyrian/Chaldean/SyriacAustralianAustrianBahamianBangladeshiBarbadianBasqueBelgianBelizeanBermudanBhutaneseBlackfeetBolivianBrazilianBritishBritish West IndianBulgarianBurmeseCajunCambodianCanadianCape VerdeanCarpatho RusynCelticCentral AmericanCentral American IndianCherokeeCheyenneChickasawChileanChineseChippewaChoctawColombianColvilleComancheCosta RicanCreeCreekCroatianCrowCubanCypriotCzechCzechoslovakianDanishDelawareDominicanDutchDutch West IndianEastern EuropeanEcuadorianEgyptianEnglishEstonianEthiopianEuropeanFijianFilipinoFinnishFrenchFrench American IndianFrench CanadianGermanGerman RussianGhanaianGreekGuamanian/ChamorroGuatemalanGuyaneseHaitianHmongHonduranHopiHoumaHungarianIcelanderIndian (Asian)IndonesianInupiatIranianIraqiIrishIroquoisIsraeliItalianJamaicanJapaneseJordanianKenyanKiowaKoreanLaotianLatvianLebaneseLiberianLithuanianLumbeeLuxembourgerMacedonianMalaysianMalteseMarshalleseMenomineeMexicanMexican American IndianMongolianMoroccanNative HawaiianNavajoNepaleseNew ZealanderNicaraguanNigerianNorthern EuropeanNorwegianOkinawanOsageOttawaPaiutePakistaniPalestinianPanamanianParaguayanPennsylvania GermanPeruvianPimaPolishPortuguesePotawatomiPuebloPuerto RicanPuget Sound SalishRomanianRussianSalvadoranSamoanScandinavianScotch-IrishScottishSeminoleSenegaleseSerbianShoshoneSierra LeoneanSiouxSlavicSlovakSloveneSomaliSouth AfricanSouth AmericanSouth American IndianSoviet UnionSpaniardSpanishSpanish AmericanSpanish American IndianSri LankanSubsaharan AfricanSudaneseSwedishSwissSyrianTaiwaneseThaiTlingit-HaidaTohono O'OdhamTonganTrinidadian and TobagonianTsimshianTurkishU.S. Virgin IslanderUgandanUkrainianUruguayanUteVenezuelanVietnameseWelshWest IndianYakamaYaquiYugoslavianYumanYup'ikZimbabwean
Immigration
NonimmigrantsImmigrantsAfghanistanAfricaAlbaniaArgentinaArmeniaAsiaAustraliaAustriaBahamasBangladeshBarbadosBelarusBelgiumBelizeBoliviaBosnia and HerzegovinaBrazilBulgariaBurma/MyanmarCabo VerdeCambodiaCameroonCanadaCaribbeanCentral AmericaChileChinaColombiaCongoCosta RicaCroatiaCubaCzechoslovakiaDenmarkDominicaDominican RepublicEastern AfricaEastern AsiaEastern EuropeEcuadorEgyptEl SalvadorEnglandEritreaEthiopiaEuropeFijiFranceGermanyGhanaGreeceGrenadaGuatemalaGuyanaHaitiHondurasHong KongHungaryIndiaIndonesiaIranIraqIrelandIsraelItalyJamaicaJapanJordanKazakhstanKenyaKoreaKuwaitLaosLatin AmericaLatviaLebanonLiberiaLithuaniaMalaysiaMexicoMicronesiaMiddle AfricaMoldovaMoroccoNepalNetherlandsNicaraguaNigeriaNorth AmericaNorth MacedoniaNorthern AfricaNorthern EuropeNorwayOceaniaPakistanPanamaPeruPhilippinesPolandPortugalRomaniaRussiaSaudi ArabiaScotlandSenegalSerbiaSierra LeoneSingaporeSomaliaSouth AfricaSouth AmericaSouth Central AsiaSouth Eastern AsiaSouthern EuropeSri LankaSt. Vincent and the GrenadinesSudanSwedenSwitzerlandSyriaTaiwanThailandTrinidad and TobagoTurkeyUgandaUkraineUruguayUzbekistanVenezuelaVietnamWest IndiesWestern AfricaWestern AsiaWestern EuropeYemenZaireZimbabweAzores
Immigrants from Spain
Race
Ancestry
AfghanAfricanAlaska NativeAlaskan AthabascanAlbanianAleutAlsatianAmericanApacheArabArapahoArgentineanArmenianAssyrian/Chaldean/SyriacAustrianBahamianBangladeshiBarbadianBasqueBelgianBelizeanBermudanBhutaneseBlackfeetBolivianBrazilianBritishBritish West IndianBulgarianBurmeseCajunCambodianCanadianCape VerdeanCarpatho RusynCelticCentral AmericanCentral American IndianCherokeeCheyenneChickasawChileanChineseChippewaChoctawColombianColvilleComancheCosta RicanCreeCreekCroatianCrowCubanCypriotCzechCzechoslovakianDanishDelawareDominicanDutchDutch West IndianEastern EuropeanEcuadorianEgyptianEnglishEstonianEthiopianEuropeanFijianFilipinoFinnishFrenchFrench American IndianFrench CanadianGermanGerman RussianGhanaianGreekGuamanian/ChamorroGuatemalanGuyaneseHaitianHmongHonduranHopiHoumaHungarianIcelanderIndian (Asian)IndonesianInupiatIranianIraqiIrishIroquoisIsraeliItalianJamaicanJapaneseJordanianKenyanKiowaKoreanLaotianLatvianLebaneseLiberianLithuanianLumbeeLuxembourgerMacedonianMalaysianMalteseMarshalleseMenomineeMexicanMexican American IndianMongolianMoroccanNative HawaiianNavajoNepaleseNew ZealanderNicaraguanNigerianNorthern EuropeanNorwegianOkinawanOsageOttawaPaiutePakistaniPalestinianPanamanianParaguayanPennsylvania GermanPeruvianPimaPolishPortuguesePotawatomiPuebloPuerto RicanPuget Sound SalishRomanianRussianSalvadoranSamoanScandinavianScotch-IrishScottishSeminoleSenegaleseSerbianShoshoneSierra LeoneanSiouxSlavicSlovakSloveneSomaliSouth AfricanSouth AmericanSouth American IndianSoviet UnionSpaniardSpanishSpanish AmericanSpanish American IndianSri LankanSubsaharan AfricanSudaneseSwedishSwissSyrianTaiwaneseThaiTlingit-HaidaTohono O'OdhamTonganTrinidadian and TobagonianTsimshianTurkishU.S. Virgin IslanderUgandanUkrainianUruguayanUteVenezuelanVietnameseWelshWest IndianYakamaYaquiYugoslavianYumanYup'ikZimbabwean
Immigration
NonimmigrantsImmigrantsAfghanistanAfricaAlbaniaArgentinaArmeniaAsiaAustraliaAustriaBahamasBangladeshBarbadosBelarusBelgiumBelizeBoliviaBosnia and HerzegovinaBrazilBulgariaBurma/MyanmarCabo VerdeCambodiaCameroonCanadaCaribbeanCentral AmericaChileChinaColombiaCongoCosta RicaCroatiaCubaCzechoslovakiaDenmarkDominicaDominican RepublicEastern AfricaEastern AsiaEastern EuropeEcuadorEgyptEl SalvadorEnglandEritreaEthiopiaEuropeFijiFranceGermanyGhanaGreeceGrenadaGuatemalaGuyanaHaitiHondurasHong KongHungaryIndiaIndonesiaIranIraqIrelandIsraelItalyJamaicaJapanJordanKazakhstanKenyaKoreaKuwaitLaosLatin AmericaLatviaLebanonLiberiaLithuaniaMalaysiaMexicoMicronesiaMiddle AfricaMoldovaMoroccoNepalNetherlandsNicaraguaNigeriaNorth AmericaNorth MacedoniaNorthern AfricaNorthern EuropeNorwayOceaniaPakistanPanamaPeruPhilippinesPolandPortugalRomaniaRussiaSaudi ArabiaScotlandSenegalSerbiaSierra LeoneSingaporeSomaliaSouth AfricaSouth AmericaSouth Central AsiaSouth Eastern AsiaSouthern EuropeSpainSri LankaSt. Vincent and the GrenadinesSudanSwedenSwitzerlandSyriaTaiwanThailandTrinidad and TobagoTurkeyUgandaUkraineUruguayUzbekistanVenezuelaVietnamWest IndiesWestern AfricaWestern AsiaWestern EuropeYemenZaireZimbabweAzores
Female Poverty
Income
Poverty
Unemployment
Labor Participation
Family Structure
Vehicle Availability
Education Level
Disability

Female Poverty Comparison

Australians

Immigrants from Spain

Exceptional
Average
12.5%
FEMALE POVERTY
95.2/ 100
METRIC RATING
97th/ 347
METRIC RANK
13.4%
FEMALE POVERTY
49.9/ 100
METRIC RATING
176th/ 347
METRIC RANK

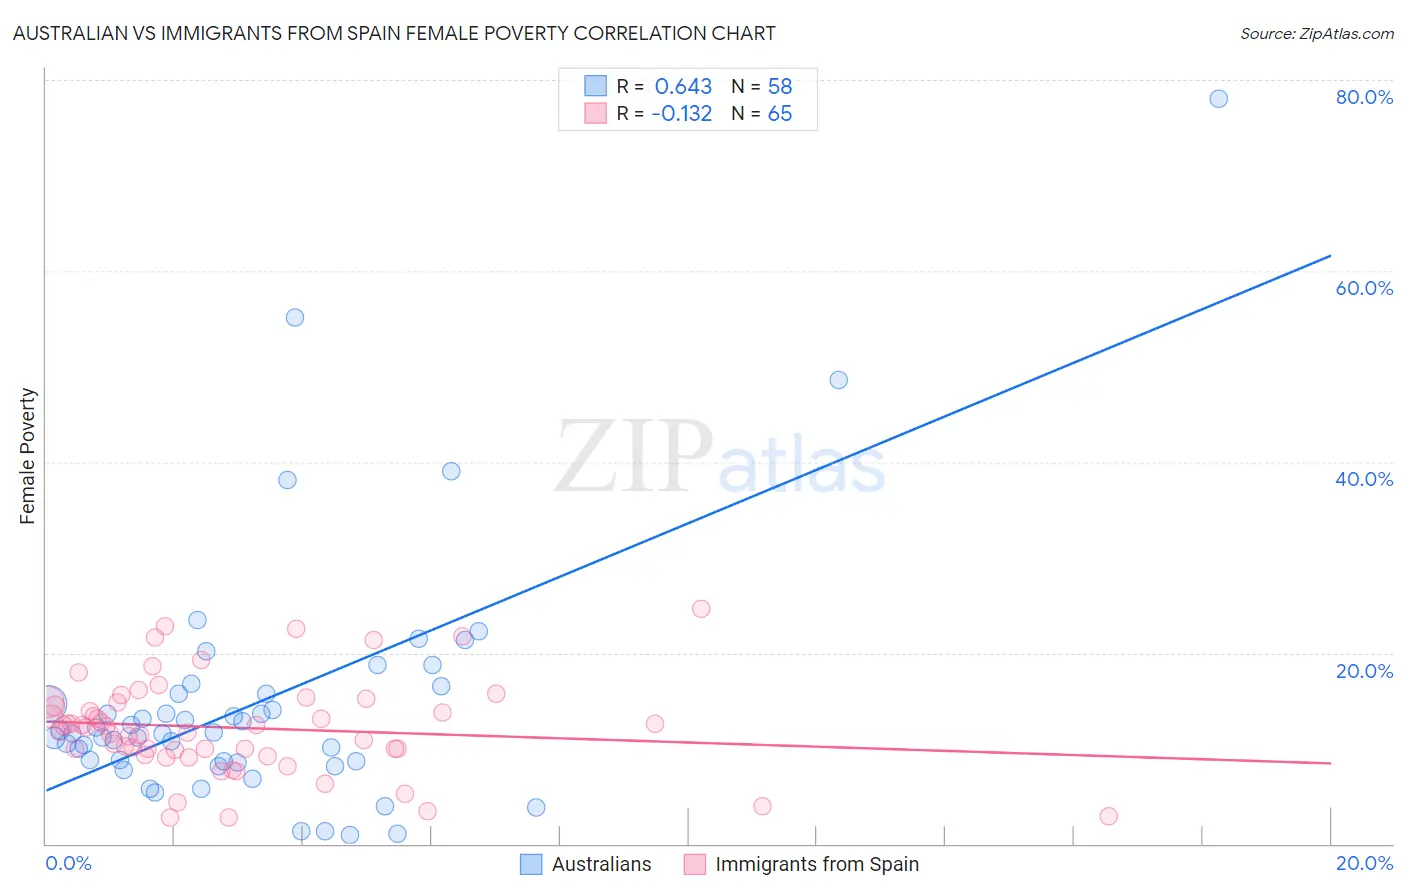
Australian vs Immigrants from Spain Female Poverty Correlation Chart

The statistical analysis conducted on geographies consisting of 223,990,985 people shows a significant positive correlation between the proportion of Australians and poverty level among females in the United States with a correlation coefficient (R) of 0.643 and weighted average of 12.5%. Similarly, the statistical analysis conducted on geographies consisting of 239,582,161 people shows a poor negative correlation between the proportion of Immigrants from Spain and poverty level among females in the United States with a correlation coefficient (R) of -0.132 and weighted average of 13.4%, a difference of 7.7%.
Australian vs Immigrants from Spain Female Poverty

Female Poverty Correlation Summary

MeasurementAustralianImmigrants from Spain
Minimum0.92%2.7%
Maximum78.1%24.6%
Range77.2%21.9%
Mean14.9%12.1%
Median11.6%12.2%
Interquartile 25% (IQ1)8.6%9.6%
Interquartile 75% (IQ3)15.8%14.8%
Interquartile Range (IQR)7.1%5.3%
Standard Deviation (Sample)13.3%5.0%
Standard Deviation (Population)13.2%4.9%

Similar Demographics by Female Poverty

Demographics Similar to Australians by Female Poverty

In terms of female poverty, the demographic groups most similar to Australians are Native Hawaiian (12.5%, a difference of 0.020%), British (12.5%, a difference of 0.030%), Romanian (12.5%, a difference of 0.050%), Immigrants from South Africa (12.5%, a difference of 0.10%), and Immigrants from Indonesia (12.5%, a difference of 0.14%).
DemographicsRating | RankFemale Poverty
Immigrants | Denmark
95.8
/100
|
#90
Exceptional
12.4%
Belgians
95.8
/100
|
#91
Exceptional
12.4%
Czechoslovakians
95.7
/100
|
#92
Exceptional
12.4%
Immigrants | Egypt
95.5
/100
|
#93
Exceptional
12.5%
Immigrants | Indonesia
95.4
/100
|
#94
Exceptional
12.5%
Immigrants | South Africa
95.4
/100
|
#95
Exceptional
12.5%
British
95.2
/100
|
#96
Exceptional
12.5%
Australians
95.2
/100
|
#97
Exceptional
12.5%
Native Hawaiians
95.1
/100
|
#98
Exceptional
12.5%
Romanians
95.1
/100
|
#99
Exceptional
12.5%
Immigrants | Latvia
94.8
/100
|
#100
Exceptional
12.5%
Tlingit-Haida
94.8
/100
|
#101
Exceptional
12.5%
Immigrants | China
94.5
/100
|
#102
Exceptional
12.5%
Slavs
94.5
/100
|
#103
Exceptional
12.5%
Palestinians
94.3
/100
|
#104
Exceptional
12.5%

Demographics Similar to Immigrants from Spain by Female Poverty

In terms of female poverty, the demographic groups most similar to Immigrants from Spain are Celtic (13.4%, a difference of 0.0%), Immigrants from Iraq (13.4%, a difference of 0.010%), Immigrants from Morocco (13.4%, a difference of 0.040%), Israeli (13.5%, a difference of 0.080%), and Immigrants from Afghanistan (13.4%, a difference of 0.090%).
DemographicsRating | RankFemale Poverty
Lebanese
55.9
/100
|
#169
Average
13.4%
Colombians
55.7
/100
|
#170
Average
13.4%
Whites/Caucasians
54.6
/100
|
#171
Average
13.4%
Mongolians
53.6
/100
|
#172
Average
13.4%
Immigrants | Afghanistan
50.8
/100
|
#173
Average
13.4%
Immigrants | Iraq
50.0
/100
|
#174
Average
13.4%
Celtics
49.9
/100
|
#175
Average
13.4%
Immigrants | Spain
49.9
/100
|
#176
Average
13.4%
Immigrants | Morocco
49.4
/100
|
#177
Average
13.4%
Israelis
49.1
/100
|
#178
Average
13.5%
Immigrants | Syria
48.8
/100
|
#179
Average
13.5%
South Americans
44.8
/100
|
#180
Average
13.5%
Venezuelans
44.5
/100
|
#181
Average
13.5%
Immigrants | Colombia
44.5
/100
|
#182
Average
13.5%
Kenyans
43.8
/100
|
#183
Average
13.5%