Australian vs French American Indian Female Poverty
COMPARE
Australian
French American Indian
Female Poverty
Female Poverty Comparison
Australians
French American Indians
12.5%
FEMALE POVERTY
95.2/ 100
METRIC RATING
97th/ 347
METRIC RANK
15.1%
FEMALE POVERTY
0.6/ 100
METRIC RATING
237th/ 347
METRIC RANK
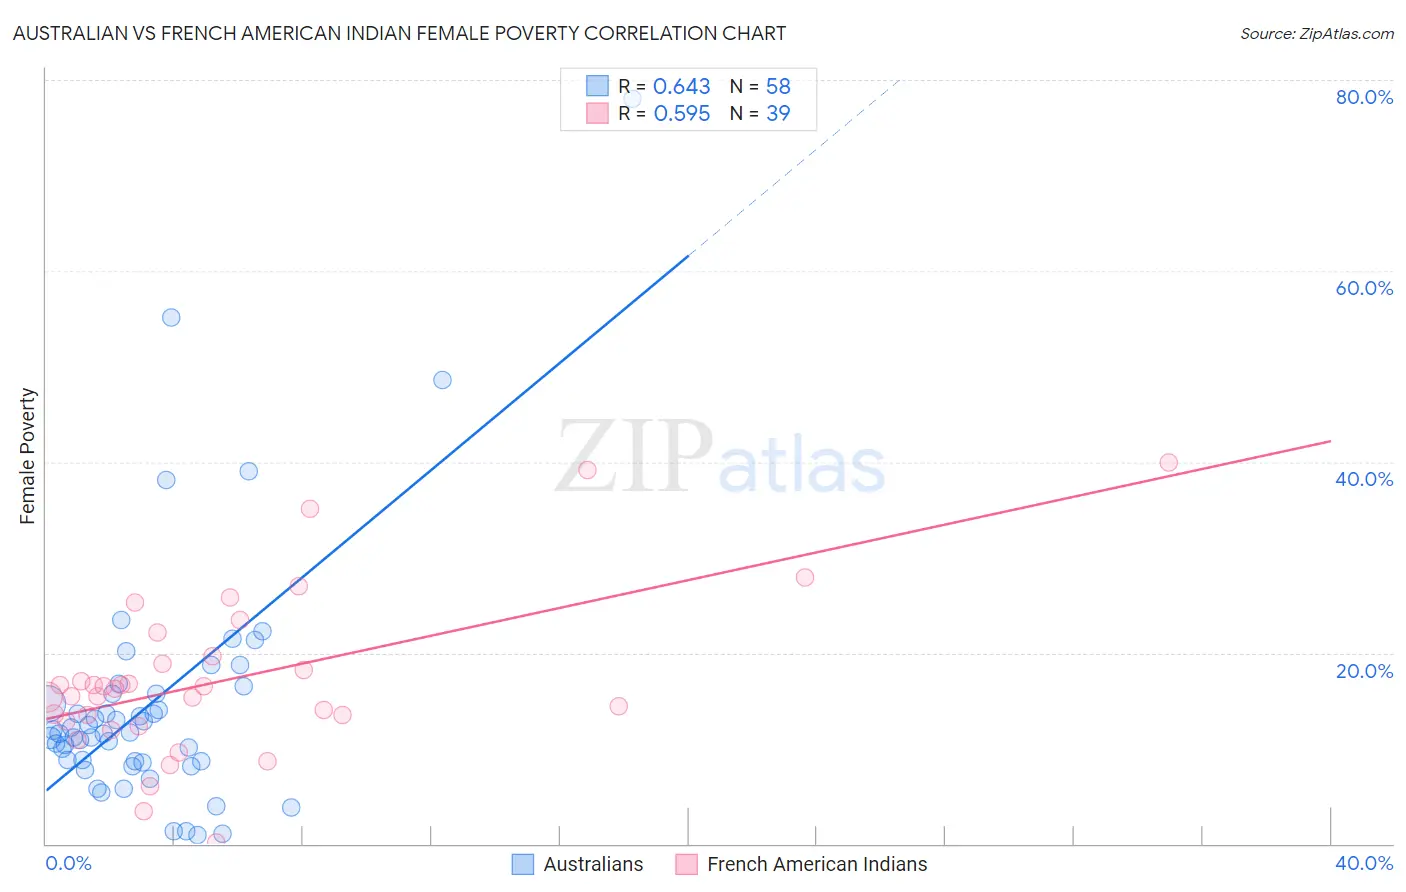
Australian vs French American Indian Female Poverty Correlation Chart
The statistical analysis conducted on geographies consisting of 223,990,985 people shows a significant positive correlation between the proportion of Australians and poverty level among females in the United States with a correlation coefficient (R) of 0.643 and weighted average of 12.5%. Similarly, the statistical analysis conducted on geographies consisting of 131,968,938 people shows a substantial positive correlation between the proportion of French American Indians and poverty level among females in the United States with a correlation coefficient (R) of 0.595 and weighted average of 15.1%, a difference of 20.9%.
Female Poverty Correlation Summary
| Measurement | Australian | French American Indian |
| Minimum | 0.92% | 0.16% |
| Maximum | 78.1% | 40.0% |
| Range | 77.2% | 39.8% |
| Mean | 14.9% | 17.2% |
| Median | 11.6% | 16.2% |
| Interquartile 25% (IQ1) | 8.6% | 12.8% |
| Interquartile 75% (IQ3) | 15.8% | 19.6% |
| Interquartile Range (IQR) | 7.1% | 6.8% |
| Standard Deviation (Sample) | 13.3% | 8.5% |
| Standard Deviation (Population) | 13.2% | 8.4% |
Similar Demographics by Female Poverty
Demographics Similar to Australians by Female Poverty
In terms of female poverty, the demographic groups most similar to Australians are Native Hawaiian (12.5%, a difference of 0.020%), British (12.5%, a difference of 0.030%), Romanian (12.5%, a difference of 0.050%), Immigrants from South Africa (12.5%, a difference of 0.10%), and Immigrants from Indonesia (12.5%, a difference of 0.14%).
| Demographics | Rating | Rank | Female Poverty |
| Immigrants | Denmark | 95.8 /100 | #90 | Exceptional 12.4% |
| Belgians | 95.8 /100 | #91 | Exceptional 12.4% |
| Czechoslovakians | 95.7 /100 | #92 | Exceptional 12.4% |
| Immigrants | Egypt | 95.5 /100 | #93 | Exceptional 12.5% |
| Immigrants | Indonesia | 95.4 /100 | #94 | Exceptional 12.5% |
| Immigrants | South Africa | 95.4 /100 | #95 | Exceptional 12.5% |
| British | 95.2 /100 | #96 | Exceptional 12.5% |
| Australians | 95.2 /100 | #97 | Exceptional 12.5% |
| Native Hawaiians | 95.1 /100 | #98 | Exceptional 12.5% |
| Romanians | 95.1 /100 | #99 | Exceptional 12.5% |
| Immigrants | Latvia | 94.8 /100 | #100 | Exceptional 12.5% |
| Tlingit-Haida | 94.8 /100 | #101 | Exceptional 12.5% |
| Immigrants | China | 94.5 /100 | #102 | Exceptional 12.5% |
| Slavs | 94.5 /100 | #103 | Exceptional 12.5% |
| Palestinians | 94.3 /100 | #104 | Exceptional 12.5% |
Demographics Similar to French American Indians by Female Poverty
In terms of female poverty, the demographic groups most similar to French American Indians are Immigrants from Armenia (15.1%, a difference of 0.080%), Cree (15.1%, a difference of 0.19%), Immigrants from Middle Africa (15.2%, a difference of 0.59%), Sudanese (15.2%, a difference of 0.65%), and Immigrants from Laos (15.0%, a difference of 0.82%).
| Demographics | Rating | Rank | Female Poverty |
| Alaska Natives | 1.8 /100 | #230 | Tragic 14.7% |
| Nigerians | 1.7 /100 | #231 | Tragic 14.8% |
| Osage | 1.5 /100 | #232 | Tragic 14.8% |
| Immigrants | Saudi Arabia | 1.4 /100 | #233 | Tragic 14.8% |
| Fijians | 1.1 /100 | #234 | Tragic 14.9% |
| Immigrants | Laos | 0.9 /100 | #235 | Tragic 15.0% |
| Cree | 0.7 /100 | #236 | Tragic 15.1% |
| French American Indians | 0.6 /100 | #237 | Tragic 15.1% |
| Immigrants | Armenia | 0.6 /100 | #238 | Tragic 15.1% |
| Immigrants | Middle Africa | 0.5 /100 | #239 | Tragic 15.2% |
| Sudanese | 0.5 /100 | #240 | Tragic 15.2% |
| Immigrants | Sudan | 0.4 /100 | #241 | Tragic 15.2% |
| Nepalese | 0.4 /100 | #242 | Tragic 15.2% |
| Nicaraguans | 0.3 /100 | #243 | Tragic 15.3% |
| Ecuadorians | 0.3 /100 | #244 | Tragic 15.3% |