Zip Codes with the Highest Percentage of Population Employed in Administrative & Support Services in Steubenville, OH
RELATED REPORTS & OPTIONS
Administrative & Support Services
Steubenville
Compare Zip Codes
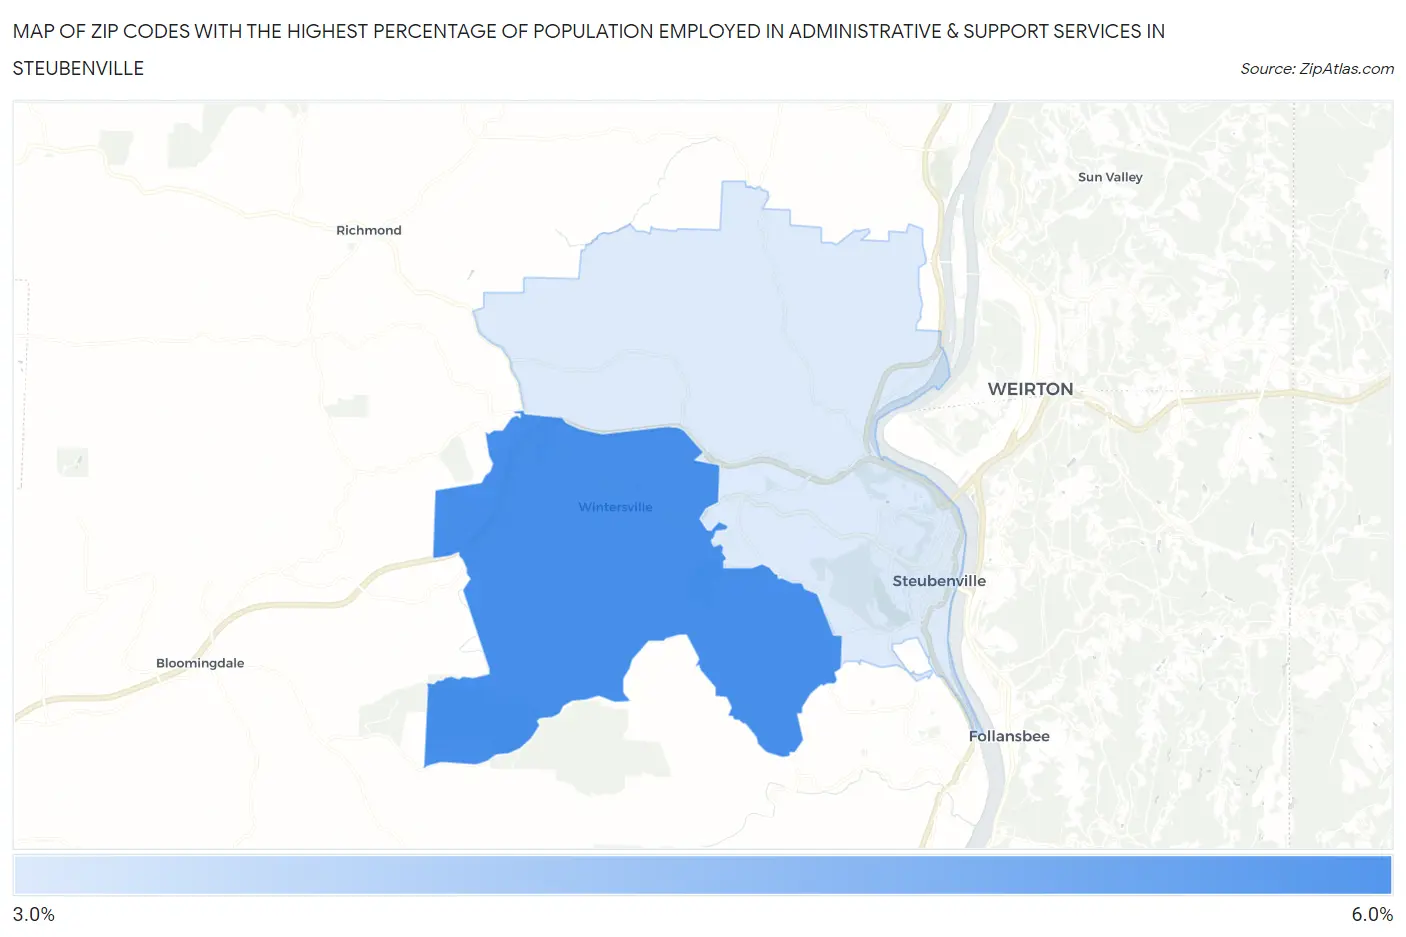
Map of Zip Codes with the Highest Percentage of Population Employed in Administrative & Support Services in Steubenville
0.0%
6.0%
Zip Codes with the Highest Percentage of Population Employed in Administrative & Support Services in Steubenville, OH
| Zip Code | % Employed | vs State | vs National | |
| 1. | 43953 | 5.1% | 3.7%(+1.42)#253 | 4.1%(+0.994)#6,723 |
| 2. | 43952 | 4.0% | 3.7%(+0.245)#417 | 4.1%(-0.180)#10,821 |
1
Common Questions
What are the Top Zip Codes with the Highest Percentage of Population Employed in Administrative & Support Services in Steubenville, OH?
Top Zip Codes with the Highest Percentage of Population Employed in Administrative & Support Services in Steubenville, OH are:
What zip code has the Highest Percentage of Population Employed in Administrative & Support Services in Steubenville, OH?
43953 has the Highest Percentage of Population Employed in Administrative & Support Services in Steubenville, OH with 5.1%.
What is the Percentage of Population Employed in Administrative & Support Services in Steubenville, OH?
Percentage of Population Employed in Administrative & Support Services in Steubenville is 5.1%.
What is the Percentage of Population Employed in Administrative & Support Services in Ohio?
Percentage of Population Employed in Administrative & Support Services in Ohio is 3.7%.
What is the Percentage of Population Employed in Administrative & Support Services in the United States?
Percentage of Population Employed in Administrative & Support Services in the United States is 4.1%.