Zip Codes with the Lowest Poverty Level Among Children Under the Age of 5 in Buffalo, NY

RELATED REPORTS & OPTIONS

Lowest Poverty | Child 0-5
Population
Families and Households
Female Fertility
Female Fertility (Unmarried)
Race (Community Size)
Race (Percentage)
Ancestry (Community Size)
AfghanAfricanAlbanianAlsatianAmericanArabArgentineanArmenianAustralianAustrianBahamianBarbadianBelgianBelizeanBhutaneseBlackfeetBolivianBrazilianBritishBritish West IndianBulgarianBurmeseCajunCambodianCanadianCarpatho RusynCelticCentral AmericanCentral American IndianCherokeeChileanChippewaColombianCosta RicanCreekCroatianCubanCzechCzechoslovakianDanishDominicanDutchDutch West IndianEastern EuropeanEcuadorianEgyptianEnglishEstonianEthiopianEuropeanFilipinoFinnishFrenchFrench American IndianFrench CanadianGermanGerman RussianGhanaianGreekGuamanian / ChamorroGuatemalanGuyaneseHaitianHonduranHungarianIcelanderIndian (Asian)IndonesianIranianIraqiIrishIroquoisIsraeliItalianJamaicanJapaneseJordanianKenyanKoreanLaotianLatvianLebaneseLithuanianMacedonianMalaysianMalteseMexicanMexican American IndianMongolianMoroccanNative HawaiianNavajoNicaraguanNigerianNorthern EuropeanNorwegianOkinawanPakistaniPalestinianPanamanianPennsylvania GermanPeruvianPolishPortuguesePuerto RicanRomanianRussianSalvadoranSamoanScandinavianScotch-IrishScottishSerbianSiouxSlavicSlovakSloveneSomaliSouth AfricanSouth AmericanSouth American IndianSpaniardSpanishSri LankanSubsaharan AfricanSudaneseSwedishSwissSyrianTaiwaneseThaiTrinidadian and TobagonianTurkishUkrainianVenezuelanVietnameseWelshWest IndianYugoslavian
Ancestry (Percentage)
AfghanAfricanAlbanianAlsatianAmericanArabArgentineanArmenianAustralianAustrianBahamianBarbadianBelgianBelizeanBhutaneseBlackfeetBolivianBrazilianBritishBritish West IndianBulgarianBurmeseCajunCambodianCanadianCarpatho RusynCelticCentral AmericanCentral American IndianCherokeeChileanChippewaColombianCosta RicanCreekCroatianCubanCzechCzechoslovakianDanishDominicanDutchDutch West IndianEastern EuropeanEcuadorianEgyptianEnglishEstonianEthiopianEuropeanFilipinoFinnishFrenchFrench American IndianFrench CanadianGermanGerman RussianGhanaianGreekGuamanian / ChamorroGuatemalanGuyaneseHaitianHonduranHungarianIcelanderIndian (Asian)IndonesianIranianIraqiIrishIroquoisIsraeliItalianJamaicanJapaneseJordanianKenyanKoreanLaotianLatvianLebaneseLithuanianMacedonianMalaysianMalteseMexicanMexican American IndianMongolianMoroccanNative HawaiianNavajoNicaraguanNigerianNorthern EuropeanNorwegianOkinawanPakistaniPalestinianPanamanianPennsylvania GermanPeruvianPolishPortuguesePuerto RicanRomanianRussianSalvadoranSamoanScandinavianScotch-IrishScottishSerbianSiouxSlavicSlovakSloveneSomaliSouth AfricanSouth AmericanSouth American IndianSpaniardSpanishSri LankanSubsaharan AfricanSudaneseSwedishSwissSyrianTaiwaneseThaiTrinidadian and TobagonianTurkishUkrainianVenezuelanVietnameseWelshWest IndianYugoslavian
Immigrant Origin (Total)
AfghanistanAfricaAlbaniaArgentinaAsiaAustraliaAustriaBangladeshBarbadosBelarusBosnia and HerzegovinaBrazilBulgariaBurma / MyanmarCameroonCanadaCaribbeanCentral AmericaChinaColombiaCongoCosta RicaCroatiaCubaCzechoslovakiaDominican RepublicEastern AfricaEastern AsiaEastern EuropeEcuadorEgyptEl SalvadorEnglandEritreaEthiopiaEuropeFranceGermanyGhanaGreeceGuatemalaGuyanaHaitiHondurasHong KongHungaryIndiaIndonesiaIranIraqIrelandIsraelItalyJamaicaJapanJordanKazakhstanKenyaKoreaKuwaitLaosLatin AmericaLatviaLebanonLiberiaLithuaniaMalaysiaMexicoMiddle AfricaMoldovaMoroccoNepalNetherlandsNigeriaNorth MacedoniaNorthern AfricaNorthern EuropeNorwayOceaniaPakistanPanamaPeruPhilippinesPolandRomaniaRussiaSaudi ArabiaScotlandSerbiaSierra LeoneSingaporeSomaliaSouth AfricaSouth AmericaSouth Central AsiaSouth Eastern AsiaSouthern EuropeSpainSri LankaSt. Vincent and the GrenadinesSudanSwedenSwitzerlandSyriaTaiwanThailandTrinidad and TobagoTurkeyUgandaUkraineUzbekistanVenezuelaVietnamWest IndiesWestern AfricaWestern AsiaWestern EuropeYemenZaire
Immigrant Origin (Percentage)
AfghanistanAfricaAlbaniaArgentinaAsiaAustraliaAustriaBangladeshBarbadosBelarusBosnia and HerzegovinaBrazilBulgariaBurma / MyanmarCameroonCanadaCaribbeanCentral AmericaChinaColombiaCongoCosta RicaCroatiaCubaCzechoslovakiaDominican RepublicEastern AfricaEastern AsiaEastern EuropeEcuadorEgyptEl SalvadorEnglandEritreaEthiopiaEuropeFranceGermanyGhanaGreeceGuatemalaGuyanaHaitiHondurasHong KongHungaryIndiaIndonesiaIranIraqIrelandIsraelItalyJamaicaJapanJordanKazakhstanKenyaKoreaKuwaitLaosLatin AmericaLatviaLebanonLiberiaLithuaniaMalaysiaMexicoMiddle AfricaMoldovaMoroccoNepalNetherlandsNigeriaNorth MacedoniaNorthern AfricaNorthern EuropeNorwayOceaniaPakistanPanamaPeruPhilippinesPolandRomaniaRussiaSaudi ArabiaScotlandSerbiaSierra LeoneSingaporeSomaliaSouth AfricaSouth AmericaSouth Central AsiaSouth Eastern AsiaSouthern EuropeSpainSri LankaSt. Vincent and the GrenadinesSudanSwedenSwitzerlandSyriaTaiwanThailandTrinidad and TobagoTurkeyUgandaUkraineUzbekistanVenezuelaVietnamWest IndiesWestern AfricaWestern AsiaWestern EuropeYemenZaire
Income
Income (Families)
Income (Households)
Poverty
Poverty (Families)
Unemployment
Employment Occupations
Employment Industries
Employer Class
Commute Time
Commute Means
School Enrollment
Education by Degree Field
Occupancy
Finances
Physical Characteristics
Buffalo
Compare Zip Codes
Comparison Subject

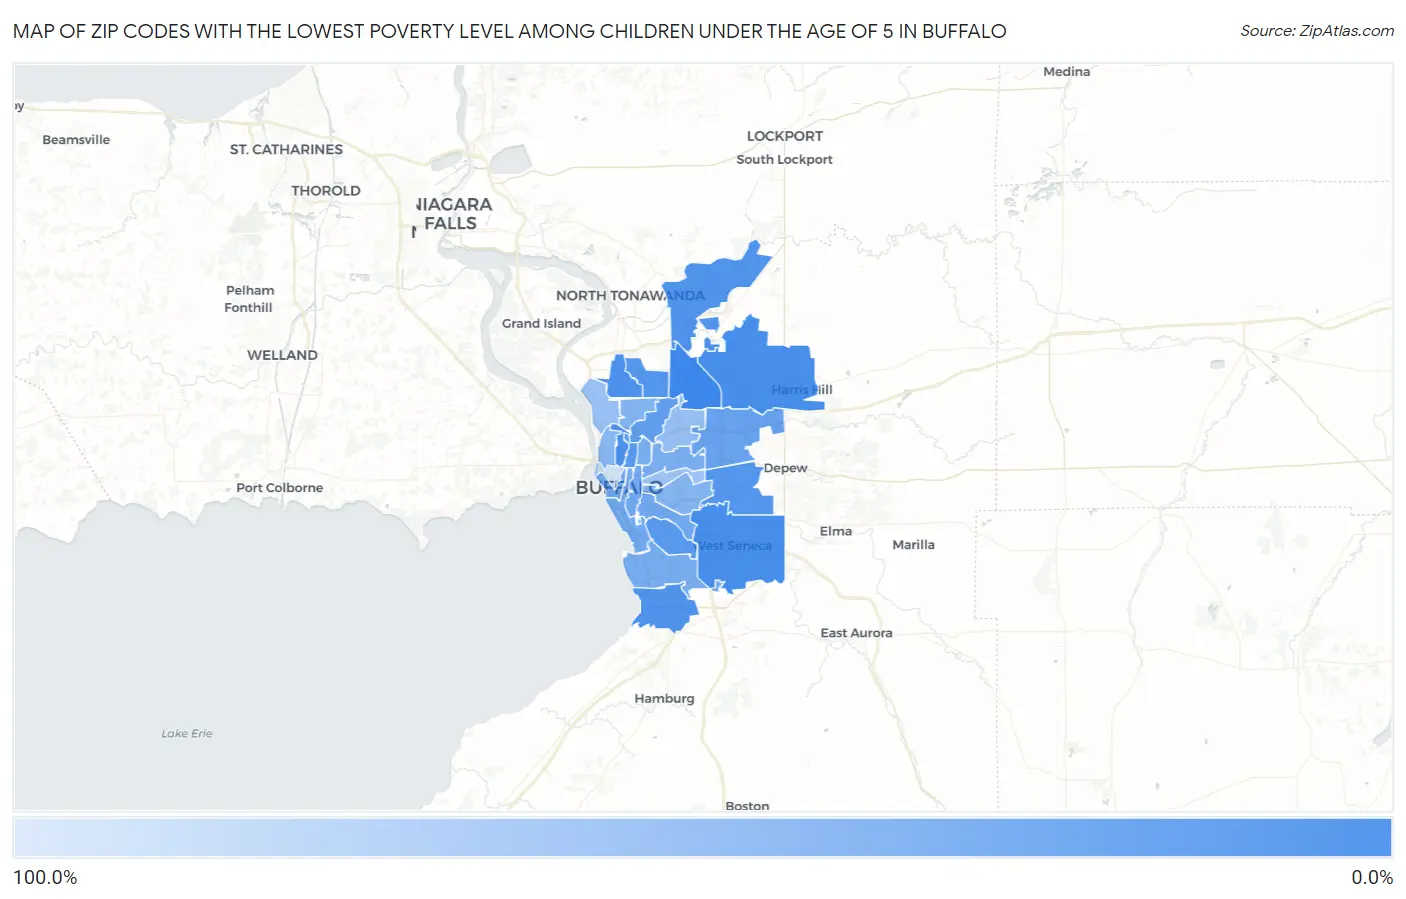
Map of Zip Codes with the Lowest Poverty Level Among Children Under the Age of 5 in Buffalo

100.0%
0.0%
Zip Codes with the Lowest Poverty Level Among Children Under the Age of 5 in Buffalo Map

Zip Codes with the Lowest Poverty Level Among Children Under the Age of 5 in Buffalo, NY

Zip Code Child Poverty vs State vs National
1.142260.74%18.7%(-18.0)#718.1%(-17.3)#145
2.142215.7%18.7%(-13.0)#20018.1%(-12.4)#3,393
3.142246.0%18.7%(-12.8)#21418.1%(-12.1)#3,580
4.142226.8%18.7%(-12.0)#24618.1%(-11.3)#4,138
5.142178.6%18.7%(-10.2)#32018.1%(-9.50)#5,294
6.142198.9%18.7%(-9.87)#33218.1%(-9.19)#5,525
7.1422811.0%18.7%(-7.74)#39618.1%(-7.05)#6,849
8.1422311.6%18.7%(-7.12)#41518.1%(-6.43)#7,215
9.1422712.3%18.7%(-6.46)#43318.1%(-5.78)#7,627
10.1422013.8%18.7%(-4.94)#47618.1%(-4.26)#8,520
11.1420914.9%18.7%(-3.86)#50518.1%(-3.18)#9,135
12.1421419.3%18.7%(+0.514)#61318.1%(+1.20)#11,295
13.1422522.8%18.7%(+4.02)#69418.1%(+4.71)#12,821
14.1420427.1%18.7%(+8.33)#76118.1%(+9.02)#14,386
15.1421027.6%18.7%(+8.86)#76818.1%(+9.55)#14,584
16.1420228.7%18.7%(+9.92)#78518.1%(+10.6)#14,925
17.1420329.7%18.7%(+10.9)#79518.1%(+11.6)#15,221
18.1421831.3%18.7%(+12.5)#80618.1%(+13.2)#15,665
19.1420832.1%18.7%(+13.3)#81618.1%(+14.0)#15,855
20.1421132.5%18.7%(+13.8)#82118.1%(+14.5)#15,959
21.1420638.1%18.7%(+19.3)#88118.1%(+20.0)#17,276
22.1421638.4%18.7%(+19.6)#88818.1%(+20.3)#17,342
23.1421341.0%18.7%(+22.3)#90318.1%(+23.0)#17,843
24.1421550.1%18.7%(+31.3)#96618.1%(+32.0)#19,157
25.1420752.3%18.7%(+33.6)#97818.1%(+34.3)#19,355
26.1421257.1%18.7%(+38.4)#1,00418.1%(+39.1)#19,774
27.1420196.2%18.7%(+77.5)#1,04618.1%(+78.2)#21,103

Common Questions

What are the Top 10 Zip Codes with the Lowest Poverty Level Among Children Under the Age of 5 in Buffalo, NY?
Top 10 Zip Codes with the Lowest Poverty Level Among Children Under the Age of 5 in Buffalo, NY are:
#1
0.74%
#2
5.7%
#3
6.0%
#4
6.8%
#5
8.6%
#6
8.9%
#7
11.0%
#8
11.6%
#9
12.3%
#10
13.8%
What zip code has the Lowest Poverty Level Among Children Under the Age of 5 in Buffalo, NY?
14226 has the Lowest Poverty Level Among Children Under the Age of 5 in Buffalo, NY with 0.74%.
What is the Poverty Level Among Children Under the Age of 5 in Buffalo, NY?
Poverty Level Among Children Under the Age of 5 in Buffalo is 40.3%.
What is the Poverty Level Among Children Under the Age of 5 in New York?
Poverty Level Among Children Under the Age of 5 in New York is 18.7%.
What is the Poverty Level Among Children Under the Age of 5 in the United States?
Poverty Level Among Children Under the Age of 5 in the United States is 18.1%.