Zip Codes with the Highest Percentage of Households with Income Below $10,000 in Buffalo, NY

RELATED REPORTS & OPTIONS

Household Income | $0-10k
Population
Families and Households
Female Fertility
Female Fertility (Unmarried)
Race (Community Size)
Race (Percentage)
Ancestry (Community Size)
AfghanAfricanAlbanianAlsatianAmericanArabArgentineanArmenianAustralianAustrianBahamianBarbadianBelgianBelizeanBhutaneseBlackfeetBolivianBrazilianBritishBritish West IndianBulgarianBurmeseCajunCambodianCanadianCarpatho RusynCelticCentral AmericanCentral American IndianCherokeeChileanChippewaColombianCosta RicanCreekCroatianCubanCzechCzechoslovakianDanishDominicanDutchDutch West IndianEastern EuropeanEcuadorianEgyptianEnglishEstonianEthiopianEuropeanFilipinoFinnishFrenchFrench American IndianFrench CanadianGermanGerman RussianGhanaianGreekGuamanian / ChamorroGuatemalanGuyaneseHaitianHonduranHungarianIcelanderIndian (Asian)IndonesianIranianIraqiIrishIroquoisIsraeliItalianJamaicanJapaneseJordanianKenyanKoreanLaotianLatvianLebaneseLithuanianMacedonianMalaysianMalteseMexicanMexican American IndianMongolianMoroccanNative HawaiianNavajoNicaraguanNigerianNorthern EuropeanNorwegianOkinawanPakistaniPalestinianPanamanianPennsylvania GermanPeruvianPolishPortuguesePuerto RicanRomanianRussianSalvadoranSamoanScandinavianScotch-IrishScottishSerbianSiouxSlavicSlovakSloveneSomaliSouth AfricanSouth AmericanSouth American IndianSpaniardSpanishSri LankanSubsaharan AfricanSudaneseSwedishSwissSyrianTaiwaneseThaiTrinidadian and TobagonianTurkishUkrainianVenezuelanVietnameseWelshWest IndianYugoslavian
Ancestry (Percentage)
AfghanAfricanAlbanianAlsatianAmericanArabArgentineanArmenianAustralianAustrianBahamianBarbadianBelgianBelizeanBhutaneseBlackfeetBolivianBrazilianBritishBritish West IndianBulgarianBurmeseCajunCambodianCanadianCarpatho RusynCelticCentral AmericanCentral American IndianCherokeeChileanChippewaColombianCosta RicanCreekCroatianCubanCzechCzechoslovakianDanishDominicanDutchDutch West IndianEastern EuropeanEcuadorianEgyptianEnglishEstonianEthiopianEuropeanFilipinoFinnishFrenchFrench American IndianFrench CanadianGermanGerman RussianGhanaianGreekGuamanian / ChamorroGuatemalanGuyaneseHaitianHonduranHungarianIcelanderIndian (Asian)IndonesianIranianIraqiIrishIroquoisIsraeliItalianJamaicanJapaneseJordanianKenyanKoreanLaotianLatvianLebaneseLithuanianMacedonianMalaysianMalteseMexicanMexican American IndianMongolianMoroccanNative HawaiianNavajoNicaraguanNigerianNorthern EuropeanNorwegianOkinawanPakistaniPalestinianPanamanianPennsylvania GermanPeruvianPolishPortuguesePuerto RicanRomanianRussianSalvadoranSamoanScandinavianScotch-IrishScottishSerbianSiouxSlavicSlovakSloveneSomaliSouth AfricanSouth AmericanSouth American IndianSpaniardSpanishSri LankanSubsaharan AfricanSudaneseSwedishSwissSyrianTaiwaneseThaiTrinidadian and TobagonianTurkishUkrainianVenezuelanVietnameseWelshWest IndianYugoslavian
Immigrant Origin (Total)
AfghanistanAfricaAlbaniaArgentinaAsiaAustraliaAustriaBangladeshBarbadosBelarusBosnia and HerzegovinaBrazilBulgariaBurma / MyanmarCameroonCanadaCaribbeanCentral AmericaChinaColombiaCongoCosta RicaCroatiaCubaCzechoslovakiaDominican RepublicEastern AfricaEastern AsiaEastern EuropeEcuadorEgyptEl SalvadorEnglandEritreaEthiopiaEuropeFranceGermanyGhanaGreeceGuatemalaGuyanaHaitiHondurasHong KongHungaryIndiaIndonesiaIranIraqIrelandIsraelItalyJamaicaJapanJordanKazakhstanKenyaKoreaKuwaitLaosLatin AmericaLatviaLebanonLiberiaLithuaniaMalaysiaMexicoMiddle AfricaMoldovaMoroccoNepalNetherlandsNigeriaNorth MacedoniaNorthern AfricaNorthern EuropeNorwayOceaniaPakistanPanamaPeruPhilippinesPolandRomaniaRussiaSaudi ArabiaScotlandSerbiaSierra LeoneSingaporeSomaliaSouth AfricaSouth AmericaSouth Central AsiaSouth Eastern AsiaSouthern EuropeSpainSri LankaSt. Vincent and the GrenadinesSudanSwedenSwitzerlandSyriaTaiwanThailandTrinidad and TobagoTurkeyUgandaUkraineUzbekistanVenezuelaVietnamWest IndiesWestern AfricaWestern AsiaWestern EuropeYemenZaire
Immigrant Origin (Percentage)
AfghanistanAfricaAlbaniaArgentinaAsiaAustraliaAustriaBangladeshBarbadosBelarusBosnia and HerzegovinaBrazilBulgariaBurma / MyanmarCameroonCanadaCaribbeanCentral AmericaChinaColombiaCongoCosta RicaCroatiaCubaCzechoslovakiaDominican RepublicEastern AfricaEastern AsiaEastern EuropeEcuadorEgyptEl SalvadorEnglandEritreaEthiopiaEuropeFranceGermanyGhanaGreeceGuatemalaGuyanaHaitiHondurasHong KongHungaryIndiaIndonesiaIranIraqIrelandIsraelItalyJamaicaJapanJordanKazakhstanKenyaKoreaKuwaitLaosLatin AmericaLatviaLebanonLiberiaLithuaniaMalaysiaMexicoMiddle AfricaMoldovaMoroccoNepalNetherlandsNigeriaNorth MacedoniaNorthern AfricaNorthern EuropeNorwayOceaniaPakistanPanamaPeruPhilippinesPolandRomaniaRussiaSaudi ArabiaScotlandSerbiaSierra LeoneSingaporeSomaliaSouth AfricaSouth AmericaSouth Central AsiaSouth Eastern AsiaSouthern EuropeSpainSri LankaSt. Vincent and the GrenadinesSudanSwedenSwitzerlandSyriaTaiwanThailandTrinidad and TobagoTurkeyUgandaUkraineUzbekistanVenezuelaVietnamWest IndiesWestern AfricaWestern AsiaWestern EuropeYemenZaire
Income
Income (Families)
Income (Households)
Poverty
Poverty (Families)
Unemployment
Employment Occupations
Employment Industries
Employer Class
Commute Time
Commute Means
School Enrollment
Education by Degree Field
Occupancy
Finances
Physical Characteristics
Buffalo
Compare Zip Codes
Comparison Subject

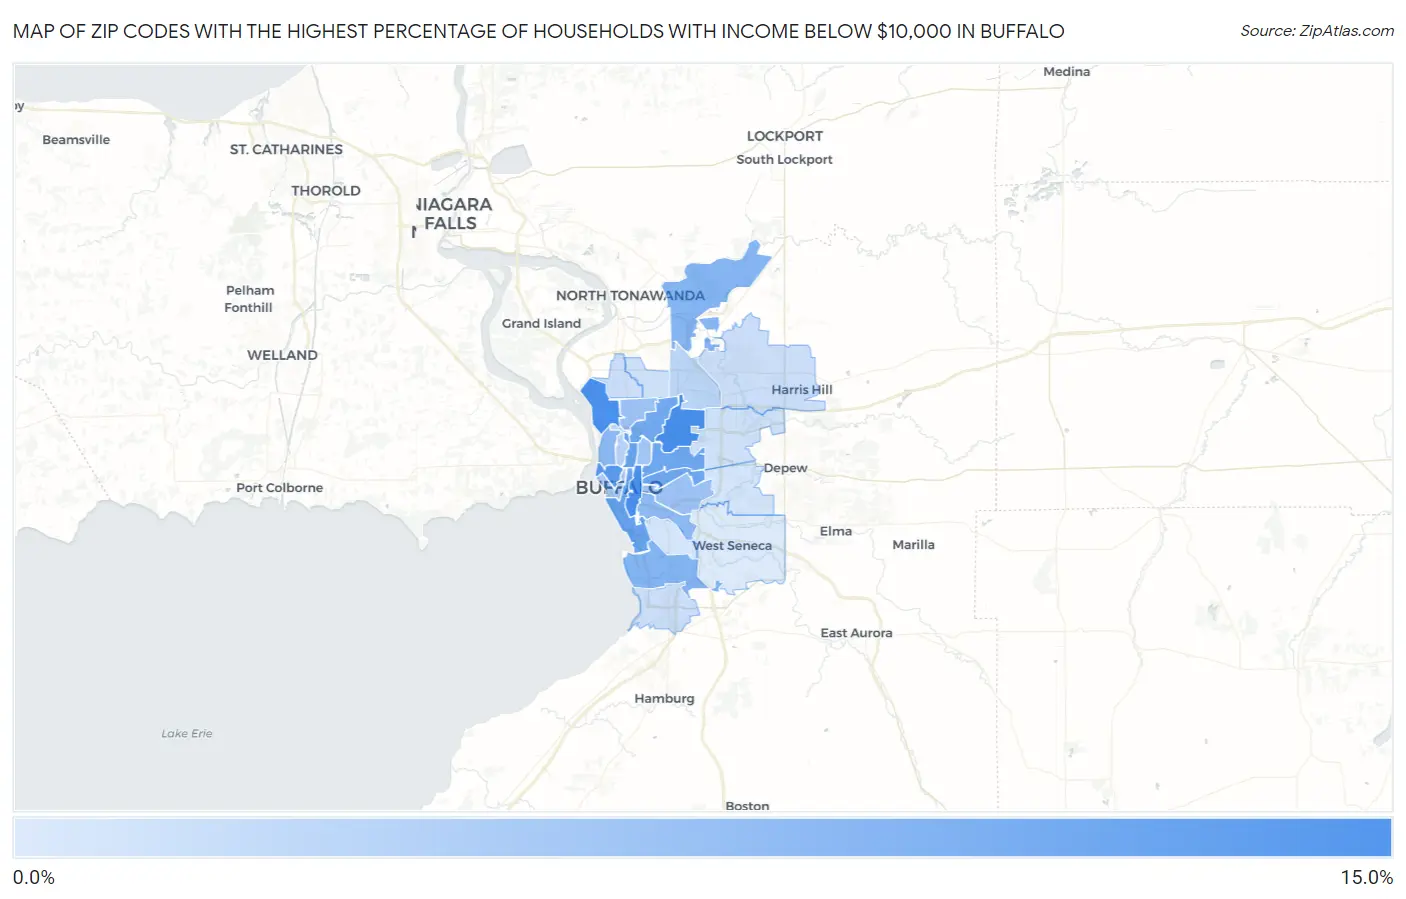
Map of Zip Codes with the Highest Percentage of Households with Income Below $10,000 in Buffalo

0.0%
15.0%
Zip Codes with the Highest Percentage of Households with Income Below $10,000 in Buffalo Map

Zip Codes with the Highest Percentage of Households with Income Below $10,000 in Buffalo, NY

Zip Code Households with Income < $10k vs State vs National
1.1421513.6%5.6%(+8.00)#754.9%(+8.70)#1,872
2.1420713.5%5.6%(+7.90)#804.9%(+8.60)#1,907
3.1420413.5%5.6%(+7.90)#814.9%(+8.60)#1,913
4.1420112.4%5.6%(+6.80)#1014.9%(+7.50)#2,298
5.1420911.2%5.6%(+5.60)#1214.9%(+6.30)#2,849
6.1420311.0%5.6%(+5.40)#1264.9%(+6.10)#2,971
7.1421110.5%5.6%(+4.90)#1364.9%(+5.60)#3,233
8.1421210.5%5.6%(+4.90)#1374.9%(+5.60)#3,237
9.1421410.2%5.6%(+4.60)#1504.9%(+5.30)#3,430
10.142189.1%5.6%(+3.50)#1854.9%(+4.20)#4,310
11.142288.8%5.6%(+3.20)#2084.9%(+3.90)#4,616
12.142138.5%5.6%(+2.90)#2224.9%(+3.60)#4,928
13.142108.2%5.6%(+2.60)#2384.9%(+3.30)#5,310
14.142167.3%5.6%(+1.70)#2954.9%(+2.40)#6,492
15.142067.2%5.6%(+1.60)#3044.9%(+2.30)#6,648
16.142086.7%5.6%(+1.10)#3434.9%(+1.80)#7,568
17.142026.1%5.6%(+0.500)#3954.9%(+1.20)#8,849
18.142225.2%5.6%(-0.400)#5184.9%(+0.300)#11,121
19.142264.9%5.6%(-0.700)#5704.9%(=0.000)#12,011
20.142213.8%5.6%(-1.80)#7884.9%(-1.10)#15,968
21.142173.8%5.6%(-1.80)#7914.9%(-1.10)#16,058
22.142193.8%5.6%(-1.80)#7954.9%(-1.10)#16,123
23.142233.5%5.6%(-2.10)#8404.9%(-1.40)#17,286
24.142253.4%5.6%(-2.20)#8634.9%(-1.50)#17,647
25.142273.2%5.6%(-2.40)#9224.9%(-1.70)#18,556
26.142203.1%5.6%(-2.50)#9414.9%(-1.80)#18,943
27.142242.5%5.6%(-3.10)#1,0724.9%(-2.40)#21,551

Common Questions

What are the Top 10 Zip Codes with the Highest Percentage of Households with Income Below $10,000 in Buffalo, NY?
Top 10 Zip Codes with the Highest Percentage of Households with Income Below $10,000 in Buffalo, NY are:
#1
13.6%
#2
13.5%
#3
13.5%
#4
12.4%
#5
11.2%
#6
11.0%
#7
10.5%
#8
10.5%
#9
10.2%
#10
9.1%
What zip code has the Highest Percentage of Households with Income Below $10,000 in Buffalo, NY?
14215 has the Highest Percentage of Households with Income Below $10,000 in Buffalo, NY with 13.6%.
What is the Percentage of Households with Income Below $10,000 in Buffalo, NY?
Percentage of Households with Income Below $10,000 in Buffalo is 9.6%.
What is the Percentage of Households with Income Below $10,000 in New York?
Percentage of Households with Income Below $10,000 in New York is 5.6%.
What is the Percentage of Households with Income Below $10,000 in the United States?
Percentage of Households with Income Below $10,000 in the United States is 4.9%.