Zip Codes with the Highest Percentage of Households Without a Vehicle in Pahrump, NV
RELATED REPORTS & OPTIONS
Households without a Cars
Pahrump
Compare Zip Codes
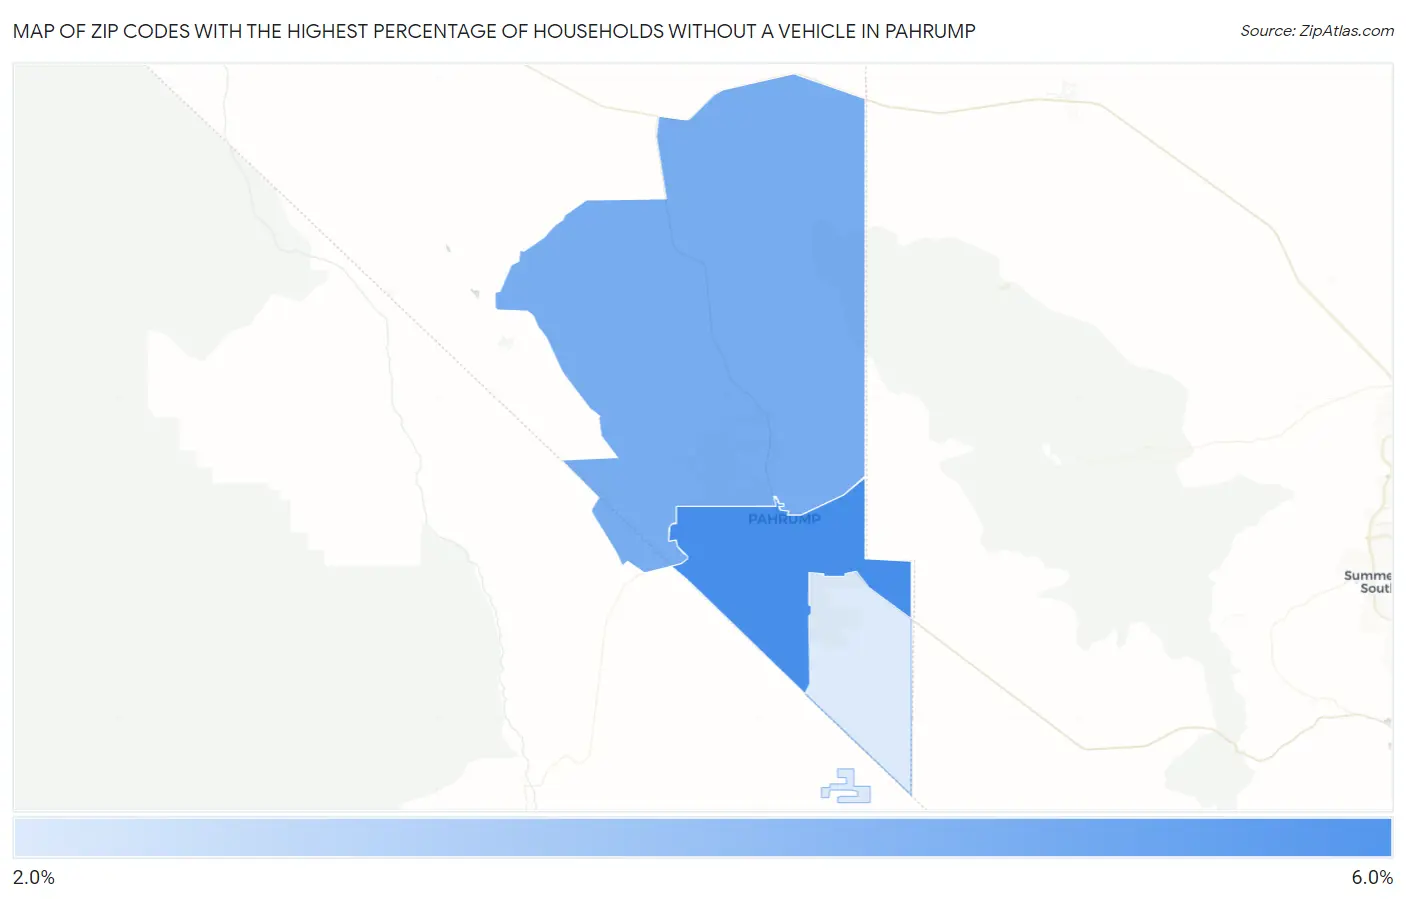
Map of Zip Codes with the Highest Percentage of Households Without a Vehicle in Pahrump
0.0%
6.0%
Zip Codes with the Highest Percentage of Households Without a Vehicle in Pahrump, NV
| Zip Code | Housholds Without a Car | vs State | vs National | |
| 1. | 89048 | 5.3% | 7.1%(-1.80)#62 | 8.3%(-3.00)#12,108 |
| 2. | 89060 | 4.2% | 7.1%(-2.90)#72 | 8.3%(-4.10)#15,178 |
| 3. | 89061 | 2.0% | 7.1%(-5.10)#113 | 8.3%(-6.30)#22,512 |
1
Common Questions
What are the Top Zip Codes with the Highest Percentage of Households Without a Vehicle in Pahrump, NV?
Top Zip Codes with the Highest Percentage of Households Without a Vehicle in Pahrump, NV are:
What zip code has the Highest Percentage of Households Without a Vehicle in Pahrump, NV?
89048 has the Highest Percentage of Households Without a Vehicle in Pahrump, NV with 5.3%.
What is the Percentage of Households Without a Vehicle in Pahrump, NV?
Percentage of Households Without a Vehicle in Pahrump is 4.5%.
What is the Percentage of Households Without a Vehicle in Nevada?
Percentage of Households Without a Vehicle in Nevada is 7.1%.
What is the Percentage of Households Without a Vehicle in the United States?
Percentage of Households Without a Vehicle in the United States is 8.3%.