Zip Codes with the Highest Percentage of Population with a Degree in Visual and Performing Arts in Millstone Township, NJ
RELATED REPORTS & OPTIONS
Visual and Performing Arts
Millstone Township
Compare Zip Codes
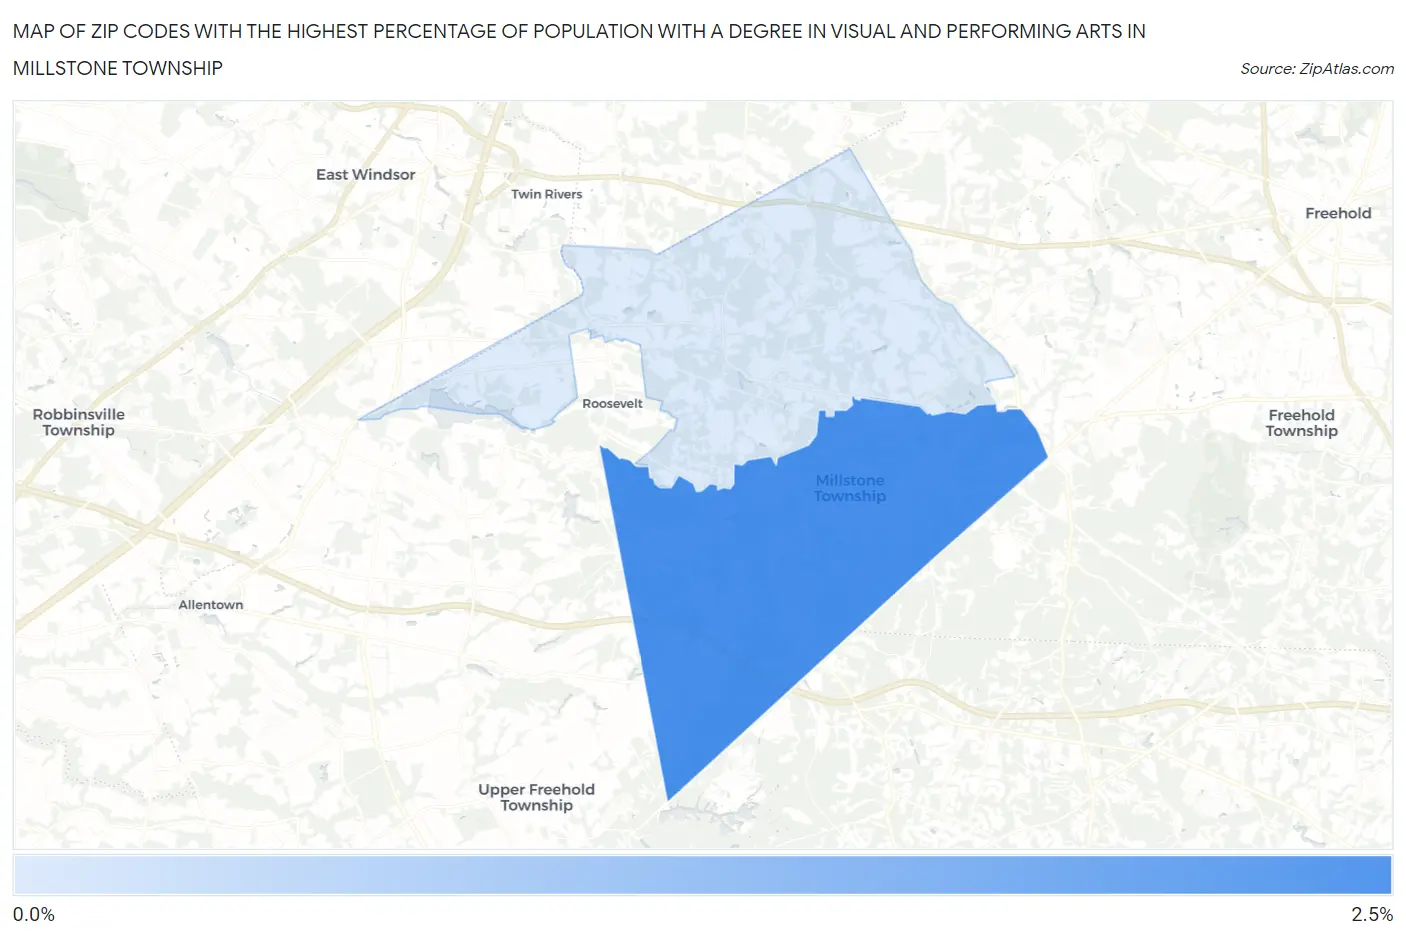
Map of Zip Codes with the Highest Percentage of Population with a Degree in Visual and Performing Arts in Millstone Township
0.0%
2.5%
Zip Codes with the Highest Percentage of Population with a Degree in Visual and Performing Arts in Millstone Township, NJ
| Zip Code | % Graduates | vs State | vs National | |
| 1. | 08510 | 2.3% | 4.0%(-1.76)#428 | 4.3%(-1.97)#15,423 |
| 2. | 08535 | 0.49% | 4.0%(-3.56)#519 | 4.3%(-3.76)#20,799 |
1
Common Questions
What are the Top Zip Codes with the Highest Percentage of Population with a Degree in Visual and Performing Arts in Millstone Township, NJ?
Top Zip Codes with the Highest Percentage of Population with a Degree in Visual and Performing Arts in Millstone Township, NJ are:
What zip code has the Highest Percentage of Population with a Degree in Visual and Performing Arts in Millstone Township, NJ?
08510 has the Highest Percentage of Population with a Degree in Visual and Performing Arts in Millstone Township, NJ with 2.3%.
What is the Percentage of Population with a Degree in Visual and Performing Arts in New Jersey?
Percentage of Population with a Degree in Visual and Performing Arts in New Jersey is 4.0%.
What is the Percentage of Population with a Degree in Visual and Performing Arts in the United States?
Percentage of Population with a Degree in Visual and Performing Arts in the United States is 4.3%.