Zip Codes with the Highest Percentage of Population with a Degree in Visual and Performing Arts in Clifton, NJ
RELATED REPORTS & OPTIONS
Visual and Performing Arts
Clifton
Compare Zip Codes
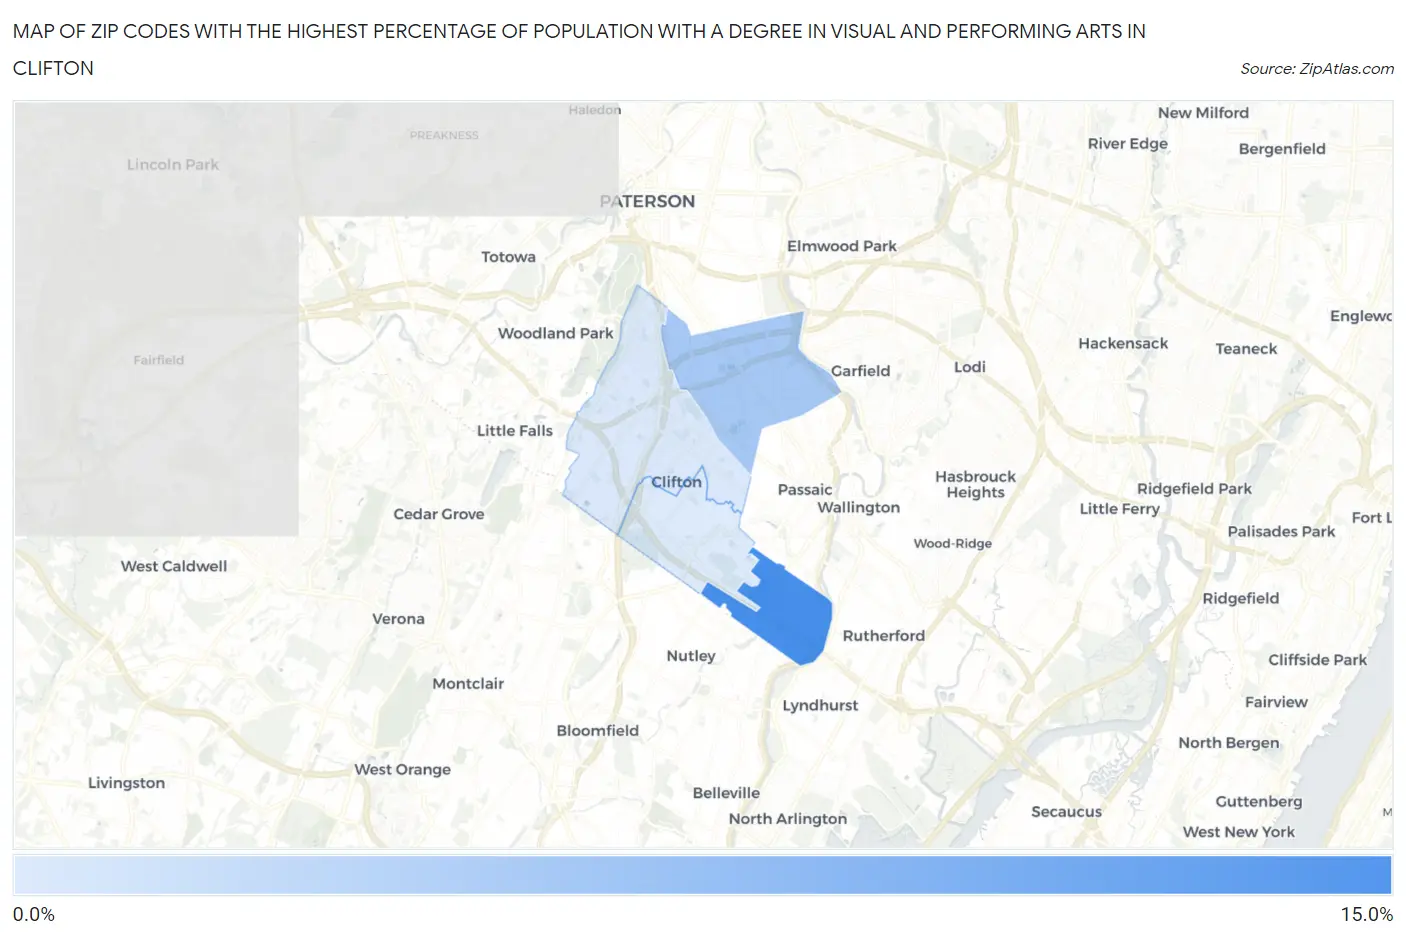
Map of Zip Codes with the Highest Percentage of Population with a Degree in Visual and Performing Arts in Clifton
0.0%
15.0%
Zip Codes with the Highest Percentage of Population with a Degree in Visual and Performing Arts in Clifton, NJ
| Zip Code | % Graduates | vs State | vs National | |
| 1. | 07014 | 10.1% | 4.0%(+6.08)#20 | 4.3%(+5.87)#1,785 |
| 2. | 07011 | 5.0% | 4.0%(+0.932)#148 | 4.3%(+0.727)#6,698 |
| 3. | 07013 | 2.3% | 4.0%(-1.74)#426 | 4.3%(-1.95)#15,365 |
| 4. | 07012 | 2.1% | 4.0%(-1.92)#446 | 4.3%(-2.13)#15,975 |
1
Common Questions
What are the Top 3 Zip Codes with the Highest Percentage of Population with a Degree in Visual and Performing Arts in Clifton, NJ?
Top 3 Zip Codes with the Highest Percentage of Population with a Degree in Visual and Performing Arts in Clifton, NJ are:
What zip code has the Highest Percentage of Population with a Degree in Visual and Performing Arts in Clifton, NJ?
07014 has the Highest Percentage of Population with a Degree in Visual and Performing Arts in Clifton, NJ with 10.1%.
What is the Percentage of Population with a Degree in Visual and Performing Arts in Clifton, NJ?
Percentage of Population with a Degree in Visual and Performing Arts in Clifton is 3.6%.
What is the Percentage of Population with a Degree in Visual and Performing Arts in New Jersey?
Percentage of Population with a Degree in Visual and Performing Arts in New Jersey is 4.0%.
What is the Percentage of Population with a Degree in Visual and Performing Arts in the United States?
Percentage of Population with a Degree in Visual and Performing Arts in the United States is 4.3%.