Zip Codes with the Highest Percentage of Population Employed in Agriculture, Fishing & Hunting in Clifton, NJ
RELATED REPORTS & OPTIONS
Agriculture, Fishing & Hunting
Clifton
Compare Zip Codes
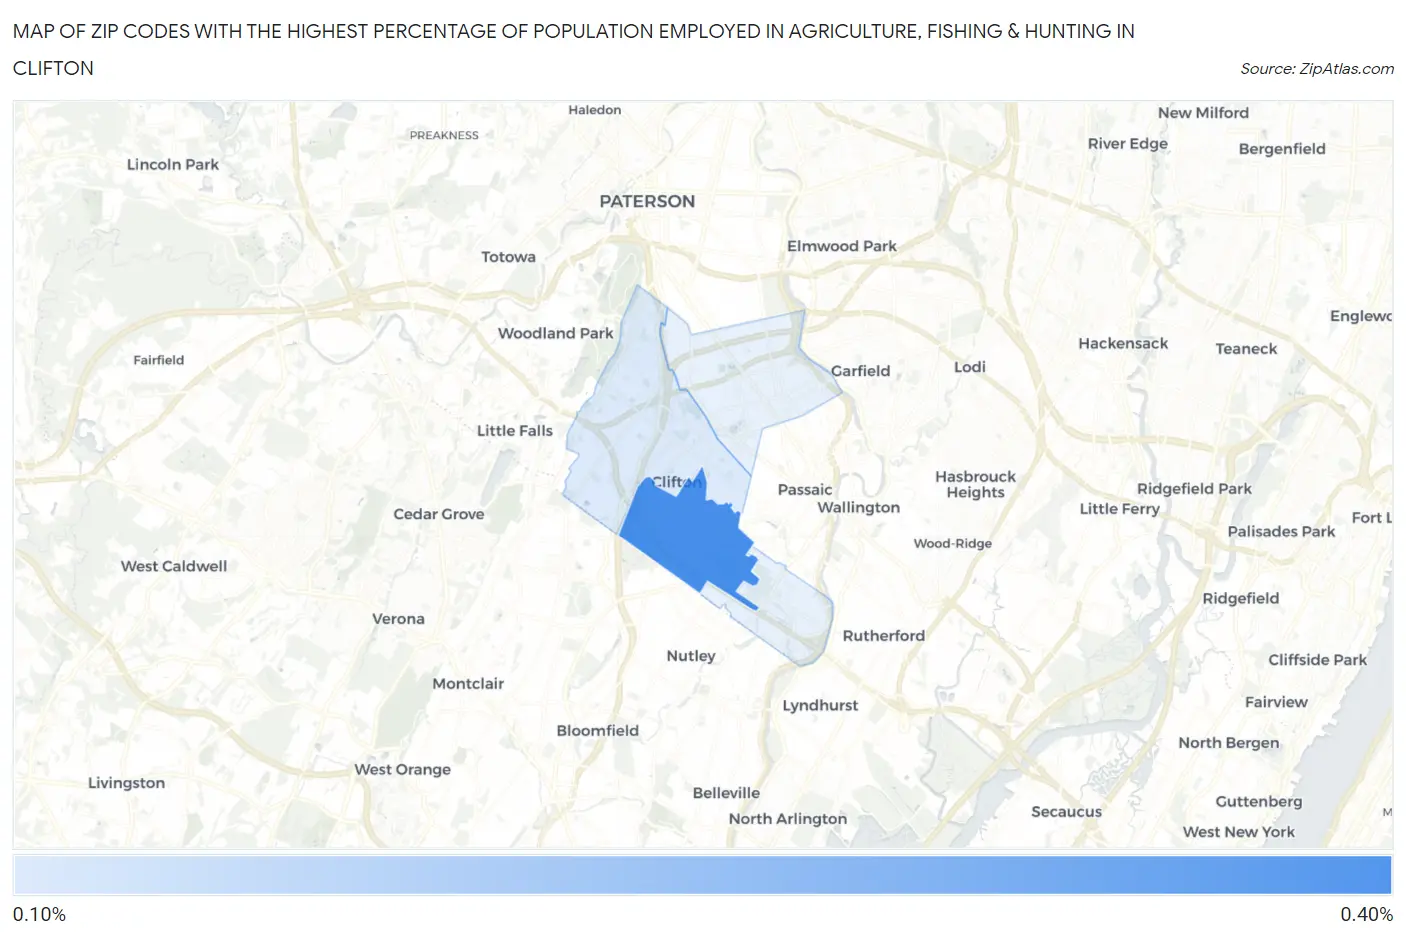
Map of Zip Codes with the Highest Percentage of Population Employed in Agriculture, Fishing & Hunting in Clifton
0.0%
0.40%
Zip Codes with the Highest Percentage of Population Employed in Agriculture, Fishing & Hunting in Clifton, NJ
| Zip Code | % Employed | vs State | vs National | |
| 1. | 07012 | 0.32% | 0.26%(+0.053)#151 | 1.2%(-0.884)#20,993 |
| 2. | 07013 | 0.12% | 0.26%(-0.143)#251 | 1.2%(-1.08)#23,415 |
1
Common Questions
What are the Top 3 Zip Codes with the Highest Percentage of Population Employed in Agriculture, Fishing & Hunting in Clifton, NJ?
Top 3 Zip Codes with the Highest Percentage of Population Employed in Agriculture, Fishing & Hunting in Clifton, NJ are:
What zip code has the Highest Percentage of Population Employed in Agriculture, Fishing & Hunting in Clifton, NJ?
07012 has the Highest Percentage of Population Employed in Agriculture, Fishing & Hunting in Clifton, NJ with 0.32%.
What is the Percentage of Population Employed in Agriculture, Fishing & Hunting in Clifton, NJ?
Percentage of Population Employed in Agriculture, Fishing & Hunting in Clifton is 0.089%.
What is the Percentage of Population Employed in Agriculture, Fishing & Hunting in New Jersey?
Percentage of Population Employed in Agriculture, Fishing & Hunting in New Jersey is 0.26%.
What is the Percentage of Population Employed in Agriculture, Fishing & Hunting in the United States?
Percentage of Population Employed in Agriculture, Fishing & Hunting in the United States is 1.2%.