Zip Codes with the Highest Percentage of Population Employed in Architecture & Engineering in Papillion, NE
RELATED REPORTS & OPTIONS
Architecture & Engineering
Papillion
Compare Zip Codes
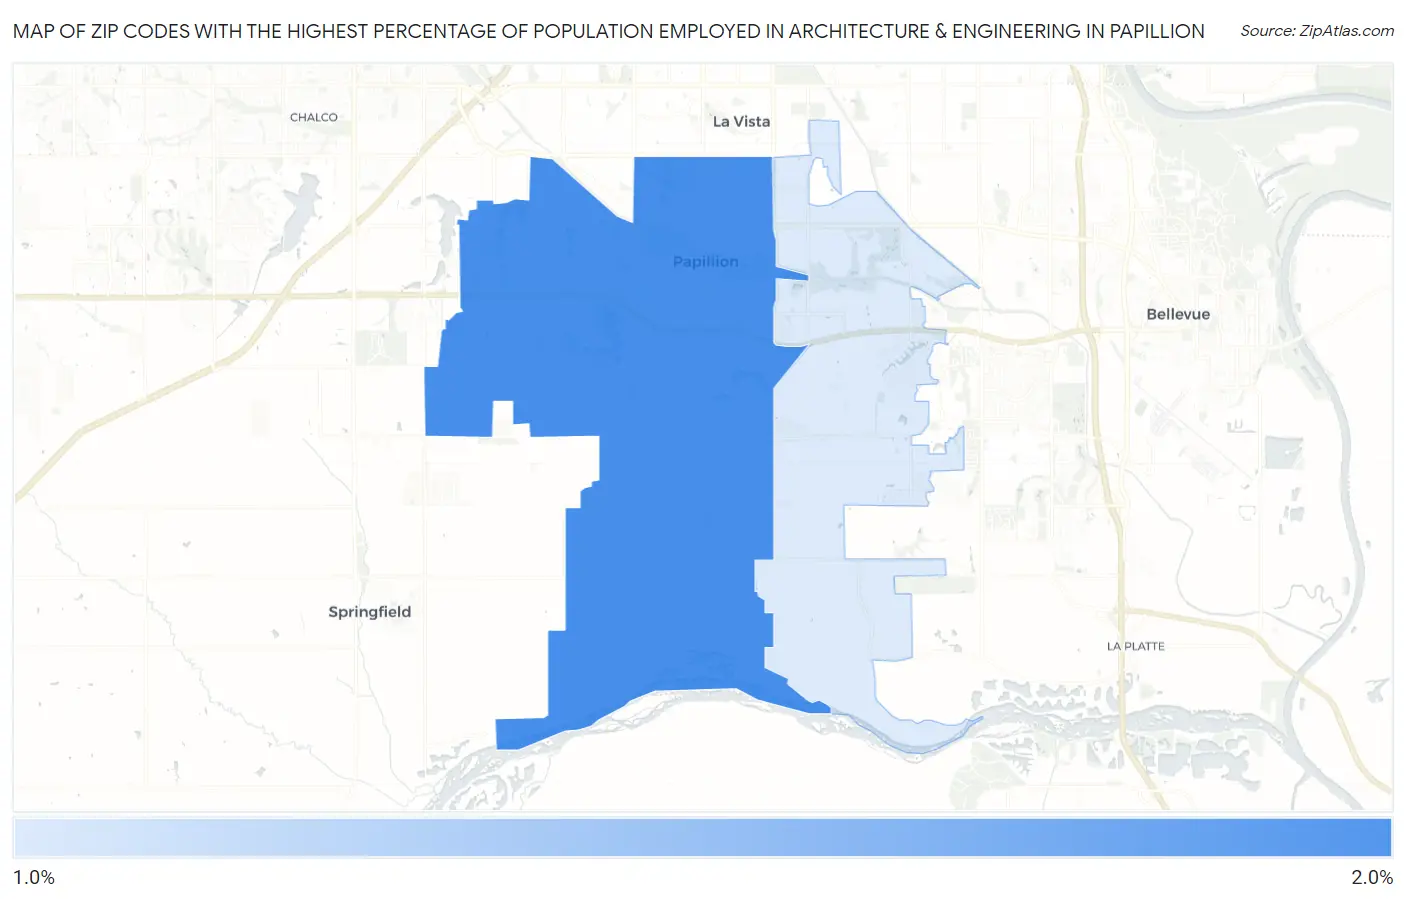
Map of Zip Codes with the Highest Percentage of Population Employed in Architecture & Engineering in Papillion
0.0%
2.0%
Zip Codes with the Highest Percentage of Population Employed in Architecture & Engineering in Papillion, NE
| Zip Code | % Employed | vs State | vs National | |
| 1. | 68046 | 1.8% | 1.5%(+0.249)#99 | 2.1%(-0.397)#11,139 |
| 2. | 68133 | 1.5% | 1.5%(-0.002)#127 | 2.1%(-0.649)#12,882 |
1
Common Questions
What are the Top Zip Codes with the Highest Percentage of Population Employed in Architecture & Engineering in Papillion, NE?
Top Zip Codes with the Highest Percentage of Population Employed in Architecture & Engineering in Papillion, NE are:
What zip code has the Highest Percentage of Population Employed in Architecture & Engineering in Papillion, NE?
68046 has the Highest Percentage of Population Employed in Architecture & Engineering in Papillion, NE with 1.8%.
What is the Percentage of Population Employed in Architecture & Engineering in Papillion, NE?
Percentage of Population Employed in Architecture & Engineering in Papillion is 1.8%.
What is the Percentage of Population Employed in Architecture & Engineering in Nebraska?
Percentage of Population Employed in Architecture & Engineering in Nebraska is 1.5%.
What is the Percentage of Population Employed in Architecture & Engineering in the United States?
Percentage of Population Employed in Architecture & Engineering in the United States is 2.1%.