Zip Codes with the Highest Percentage of Population Employed in Agriculture, Fishing & Hunting in Papillion, NE
RELATED REPORTS & OPTIONS
Agriculture, Fishing & Hunting
Papillion
Compare Zip Codes
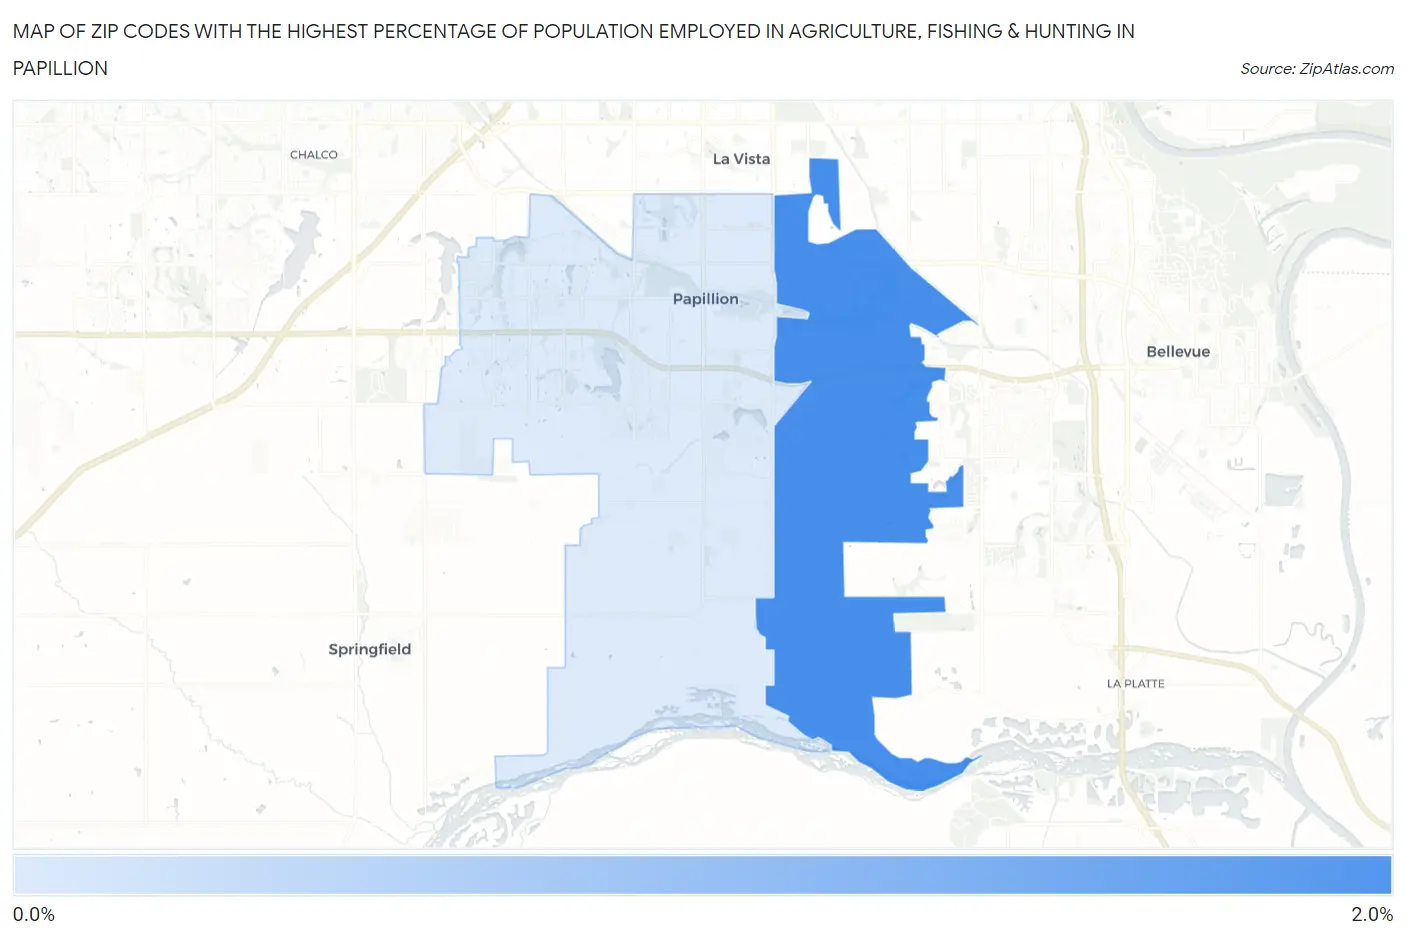
Map of Zip Codes with the Highest Percentage of Population Employed in Agriculture, Fishing & Hunting in Papillion
0.0%
2.0%
Zip Codes with the Highest Percentage of Population Employed in Agriculture, Fishing & Hunting in Papillion, NE
| Zip Code | % Employed | vs State | vs National | |
| 1. | 68133 | 1.5% | 4.1%(-2.63)#497 | 1.2%(+0.315)#14,245 |
| 2. | 68046 | 0.24% | 4.1%(-3.90)#548 | 1.2%(-0.962)#21,912 |
1
Common Questions
What are the Top Zip Codes with the Highest Percentage of Population Employed in Agriculture, Fishing & Hunting in Papillion, NE?
Top Zip Codes with the Highest Percentage of Population Employed in Agriculture, Fishing & Hunting in Papillion, NE are:
What zip code has the Highest Percentage of Population Employed in Agriculture, Fishing & Hunting in Papillion, NE?
68133 has the Highest Percentage of Population Employed in Agriculture, Fishing & Hunting in Papillion, NE with 1.5%.
What is the Percentage of Population Employed in Agriculture, Fishing & Hunting in Papillion, NE?
Percentage of Population Employed in Agriculture, Fishing & Hunting in Papillion is 0.23%.
What is the Percentage of Population Employed in Agriculture, Fishing & Hunting in Nebraska?
Percentage of Population Employed in Agriculture, Fishing & Hunting in Nebraska is 4.1%.
What is the Percentage of Population Employed in Agriculture, Fishing & Hunting in the United States?
Percentage of Population Employed in Agriculture, Fishing & Hunting in the United States is 1.2%.