Zip Codes with the Highest Percentage of Population Employed in Architecture & Engineering in Bellevue, NE
RELATED REPORTS & OPTIONS
Architecture & Engineering
Bellevue
Compare Zip Codes
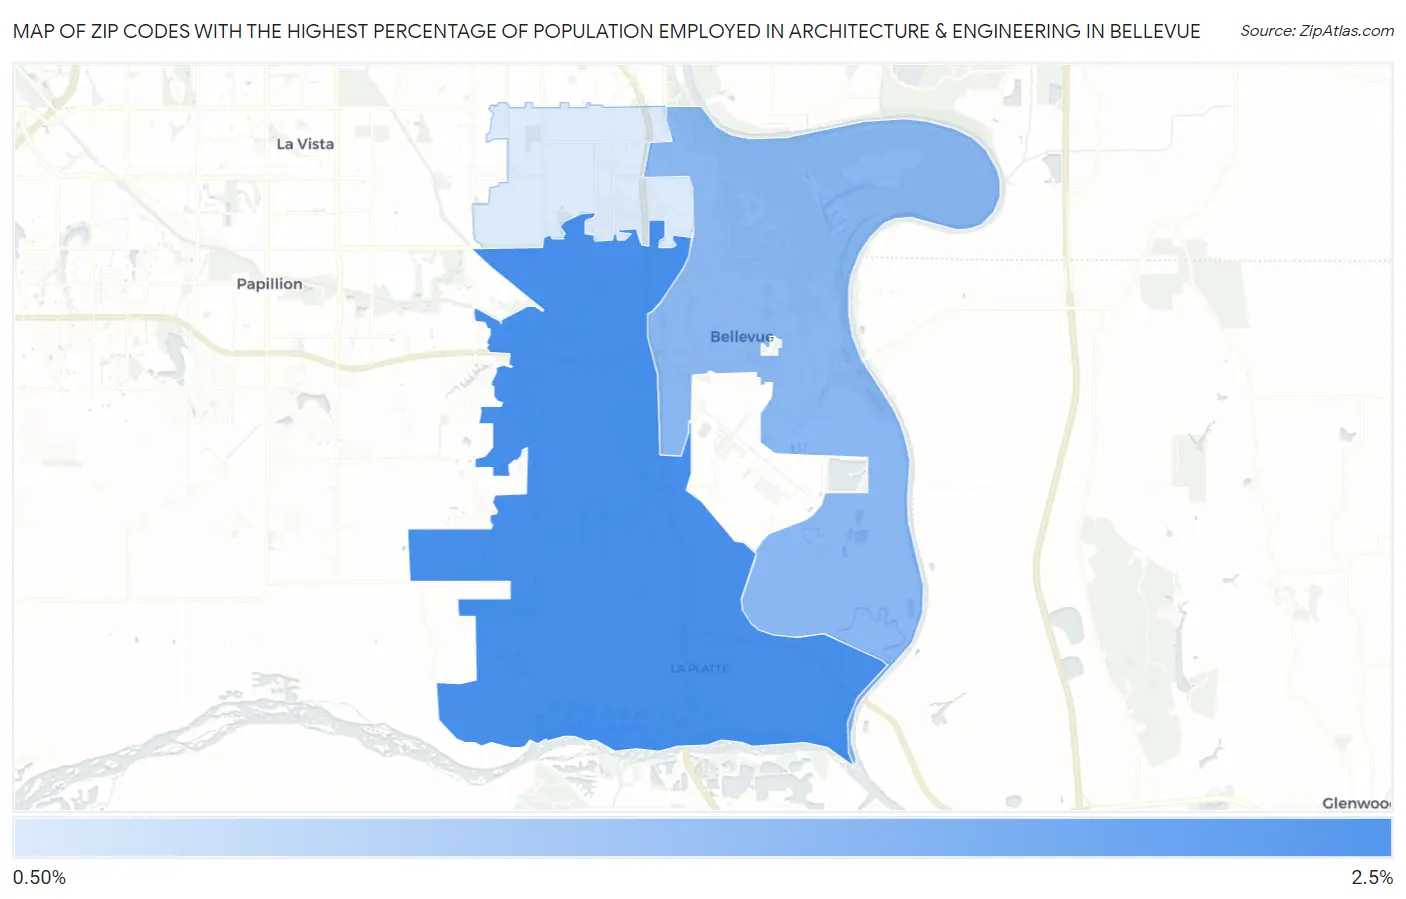
Map of Zip Codes with the Highest Percentage of Population Employed in Architecture & Engineering in Bellevue
0.0%
2.5%
Zip Codes with the Highest Percentage of Population Employed in Architecture & Engineering in Bellevue, NE
| Zip Code | % Employed | vs State | vs National | |
| 1. | 68123 | 2.3% | 1.5%(+0.825)#71 | 2.1%(+0.179)#7,809 |
| 2. | 68005 | 2.0% | 1.5%(+0.451)#91 | 2.1%(-0.195)#9,886 |
| 3. | 68147 | 1.5% | 1.5%(-0.020)#130 | 2.1%(-0.667)#13,013 |
1
Common Questions
What are the Top Zip Codes with the Highest Percentage of Population Employed in Architecture & Engineering in Bellevue, NE?
Top Zip Codes with the Highest Percentage of Population Employed in Architecture & Engineering in Bellevue, NE are:
What zip code has the Highest Percentage of Population Employed in Architecture & Engineering in Bellevue, NE?
68123 has the Highest Percentage of Population Employed in Architecture & Engineering in Bellevue, NE with 2.3%.
What is the Percentage of Population Employed in Architecture & Engineering in Bellevue, NE?
Percentage of Population Employed in Architecture & Engineering in Bellevue is 2.5%.
What is the Percentage of Population Employed in Architecture & Engineering in Nebraska?
Percentage of Population Employed in Architecture & Engineering in Nebraska is 1.5%.
What is the Percentage of Population Employed in Architecture & Engineering in the United States?
Percentage of Population Employed in Architecture & Engineering in the United States is 2.1%.