Zip Codes with the Highest Percentage of Households With Two or more Vehicles in Papillion, NE
RELATED REPORTS & OPTIONS
Households with 2 or more Cars
Papillion
Compare Zip Codes
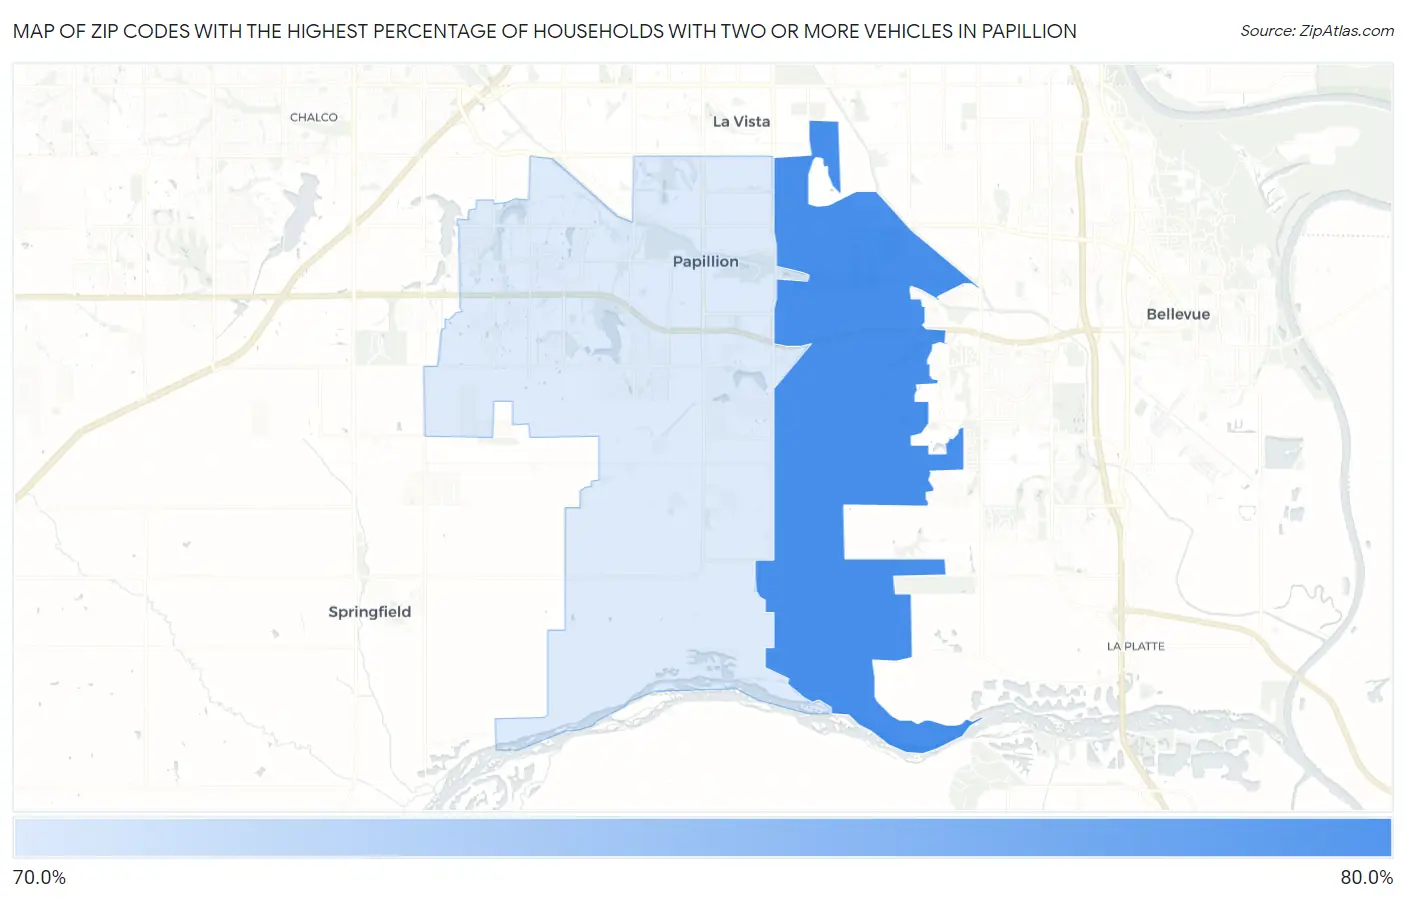
Map of Zip Codes with the Highest Percentage of Households With Two or more Vehicles in Papillion
0.0%
80.0%
Zip Codes with the Highest Percentage of Households With Two or more Vehicles in Papillion, NE
| Zip Code | Housholds With 2+ Cars | vs State | vs National | |
| 1. | 68133 | 74.1% | 65.2%(+8.90)#339 | 59.1%(+15.0)#9,774 |
| 2. | 68046 | 71.2% | 65.2%(+6.00)#404 | 59.1%(+12.1)#12,465 |
1
Common Questions
What are the Top Zip Codes with the Highest Percentage of Households With Two or more Vehicles in Papillion, NE?
Top Zip Codes with the Highest Percentage of Households With Two or more Vehicles in Papillion, NE are:
What zip code has the Highest Percentage of Households With Two or more Vehicles in Papillion, NE?
68133 has the Highest Percentage of Households With Two or more Vehicles in Papillion, NE with 74.1%.
What is the Percentage of Households With Two or more Vehicles in Papillion, NE?
Percentage of Households With Two or more Vehicles in Papillion is 69.2%.
What is the Percentage of Households With Two or more Vehicles in Nebraska?
Percentage of Households With Two or more Vehicles in Nebraska is 65.2%.
What is the Percentage of Households With Two or more Vehicles in the United States?
Percentage of Households With Two or more Vehicles in the United States is 59.1%.