Zip Codes with the Highest Percentage of Population with a Degree in Visual and Performing Arts in Grand Forks, ND
RELATED REPORTS & OPTIONS
Visual and Performing Arts
Grand Forks
Compare Zip Codes
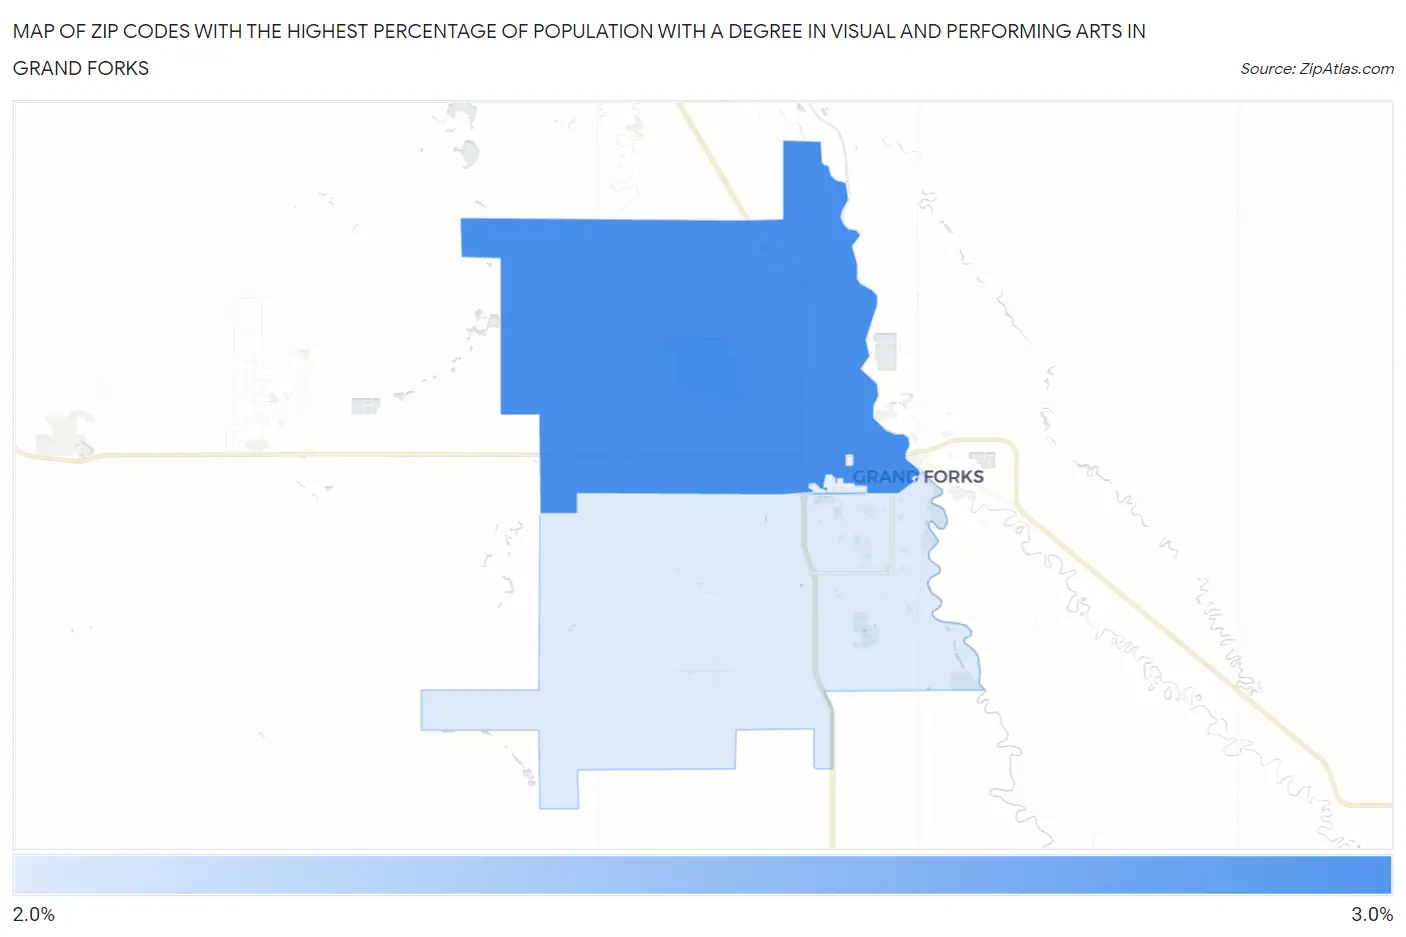
Map of Zip Codes with the Highest Percentage of Population with a Degree in Visual and Performing Arts in Grand Forks
0.0%
3.0%
Zip Codes with the Highest Percentage of Population with a Degree in Visual and Performing Arts in Grand Forks, ND
| Zip Code | % Graduates | vs State | vs National | |
| 1. | 58203 | 2.5% | 2.3%(+0.272)#67 | 4.3%(-1.71)#14,465 |
| 2. | 58201 | 2.4% | 2.3%(+0.119)#69 | 4.3%(-1.86)#15,040 |
1
Common Questions
What are the Top Zip Codes with the Highest Percentage of Population with a Degree in Visual and Performing Arts in Grand Forks, ND?
Top Zip Codes with the Highest Percentage of Population with a Degree in Visual and Performing Arts in Grand Forks, ND are:
What zip code has the Highest Percentage of Population with a Degree in Visual and Performing Arts in Grand Forks, ND?
58203 has the Highest Percentage of Population with a Degree in Visual and Performing Arts in Grand Forks, ND with 2.5%.
What is the Percentage of Population with a Degree in Visual and Performing Arts in Grand Forks, ND?
Percentage of Population with a Degree in Visual and Performing Arts in Grand Forks is 2.5%.
What is the Percentage of Population with a Degree in Visual and Performing Arts in North Dakota?
Percentage of Population with a Degree in Visual and Performing Arts in North Dakota is 2.3%.
What is the Percentage of Population with a Degree in Visual and Performing Arts in the United States?
Percentage of Population with a Degree in Visual and Performing Arts in the United States is 4.3%.