Zip Codes with the Highest Percentage of Population Employed in Food Preparation & Serving in Grand Forks, ND
RELATED REPORTS & OPTIONS
Food Preparation & Serving
Grand Forks
Compare Zip Codes
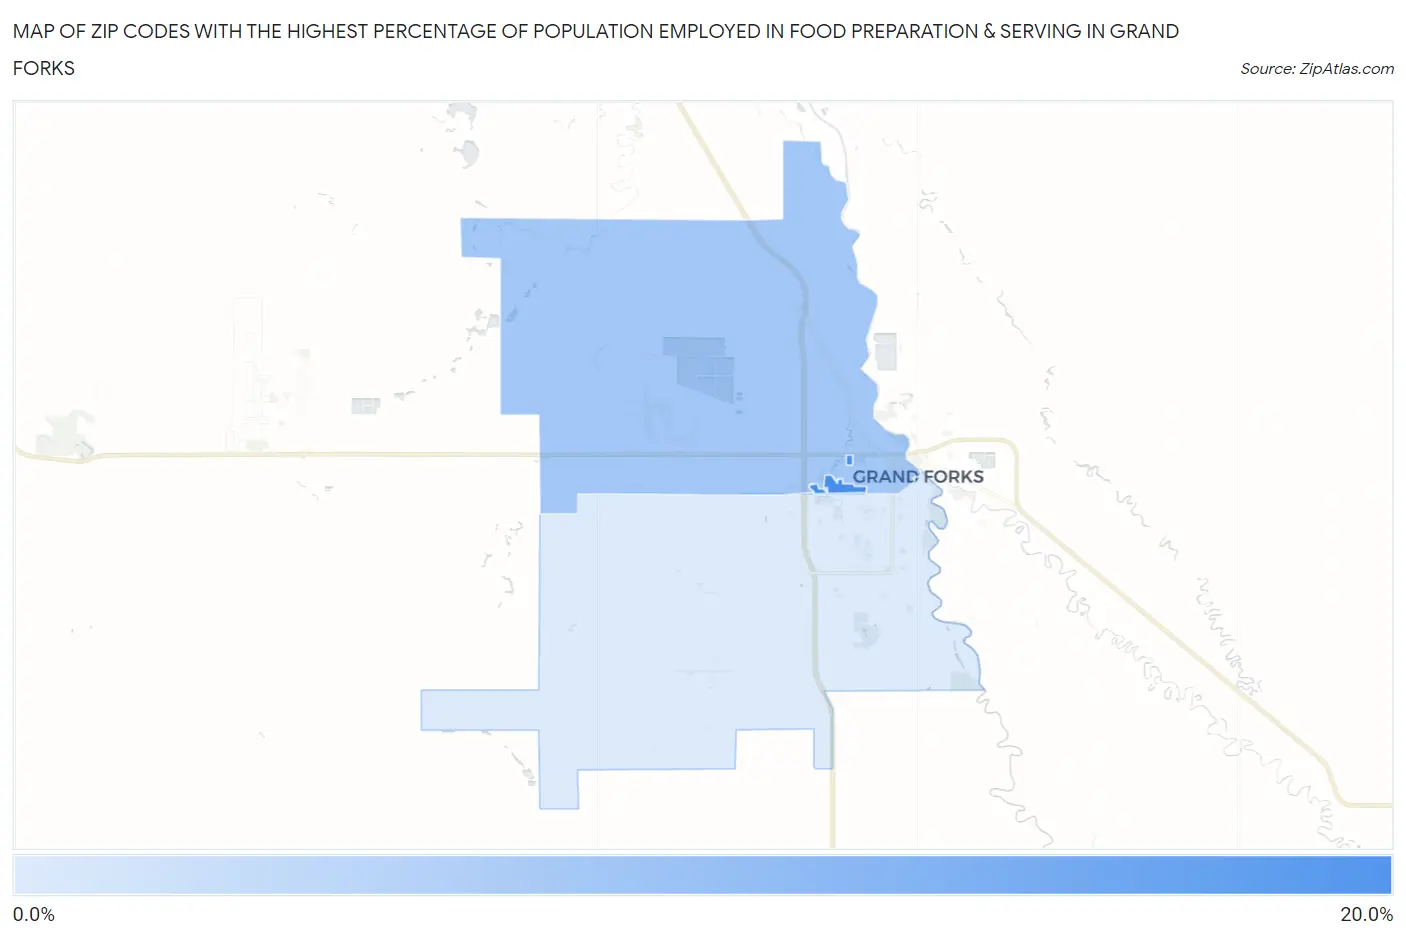
Map of Zip Codes with the Highest Percentage of Population Employed in Food Preparation & Serving in Grand Forks
0.0%
20.0%
Zip Codes with the Highest Percentage of Population Employed in Food Preparation & Serving in Grand Forks, ND
| Zip Code | % Employed | vs State | vs National | |
| 1. | 58202 | 18.2% | 5.2%(+13.0)#6 | 5.3%(+12.9)#638 |
| 2. | 58203 | 9.4% | 5.2%(+4.16)#34 | 5.3%(+4.11)#3,149 |
| 3. | 58201 | 4.3% | 5.2%(-0.901)#127 | 5.3%(-0.958)#15,748 |
1
Common Questions
What are the Top Zip Codes with the Highest Percentage of Population Employed in Food Preparation & Serving in Grand Forks, ND?
Top Zip Codes with the Highest Percentage of Population Employed in Food Preparation & Serving in Grand Forks, ND are:
What zip code has the Highest Percentage of Population Employed in Food Preparation & Serving in Grand Forks, ND?
58202 has the Highest Percentage of Population Employed in Food Preparation & Serving in Grand Forks, ND with 18.2%.
What is the Percentage of Population Employed in Food Preparation & Serving in Grand Forks, ND?
Percentage of Population Employed in Food Preparation & Serving in Grand Forks is 6.6%.
What is the Percentage of Population Employed in Food Preparation & Serving in North Dakota?
Percentage of Population Employed in Food Preparation & Serving in North Dakota is 5.2%.
What is the Percentage of Population Employed in Food Preparation & Serving in the United States?
Percentage of Population Employed in Food Preparation & Serving in the United States is 5.3%.