Zip Codes with the Highest Percentage of Population Employed in Accommodation & Food Services in Grand Forks, ND
RELATED REPORTS & OPTIONS
Accommodation & Food Services
Grand Forks
Compare Zip Codes
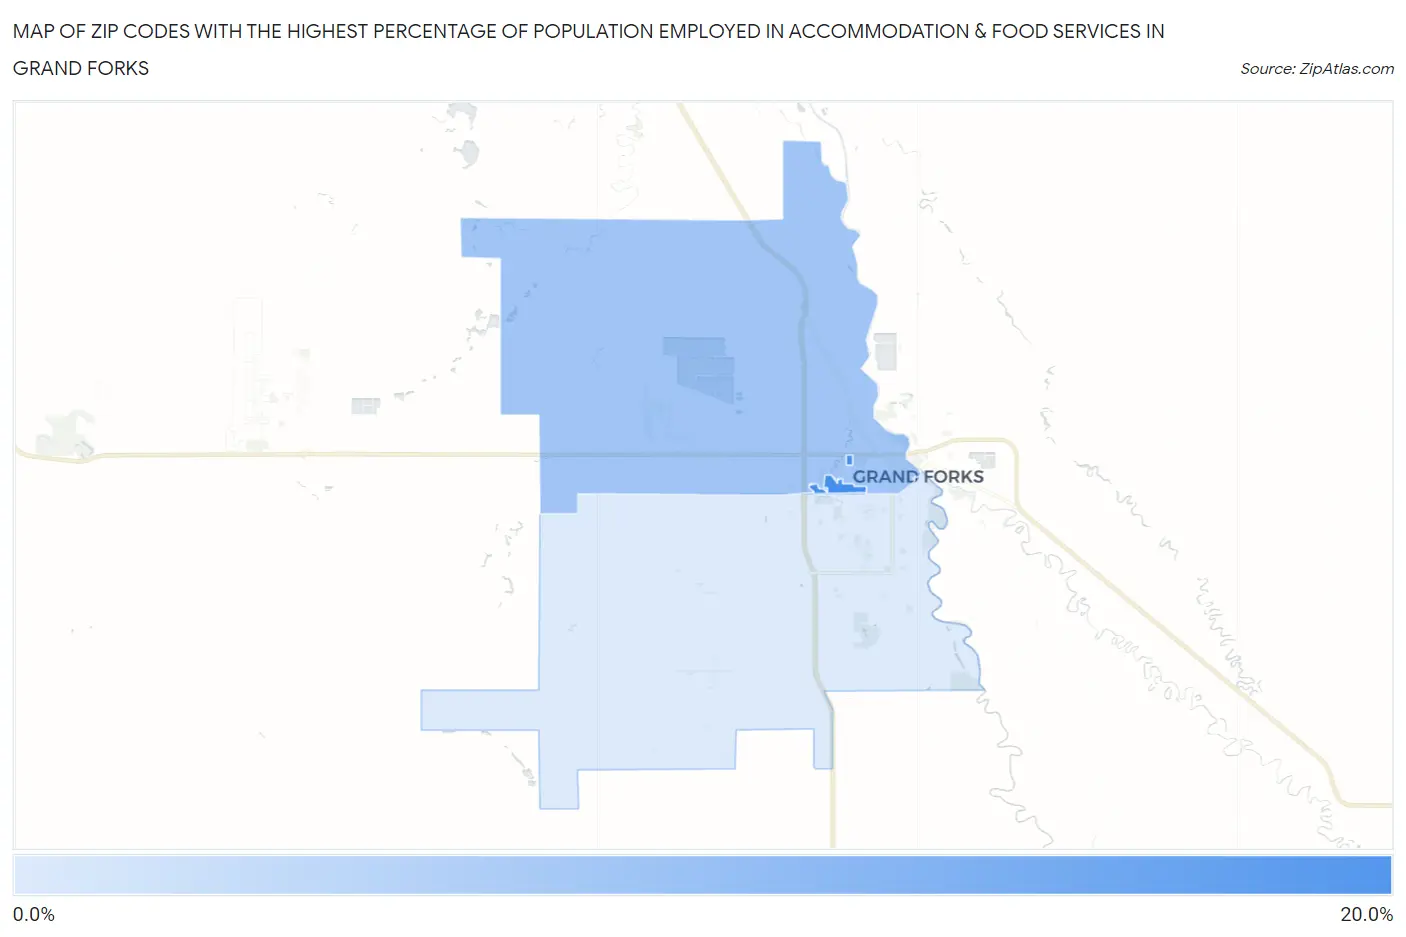
Map of Zip Codes with the Highest Percentage of Population Employed in Accommodation & Food Services in Grand Forks
0.0%
20.0%
Zip Codes with the Highest Percentage of Population Employed in Accommodation & Food Services in Grand Forks, ND
| Zip Code | % Employed | vs State | vs National | |
| 1. | 58202 | 15.5% | 6.0%(+9.52)#14 | 6.9%(+8.67)#1,546 |
| 2. | 58203 | 10.0% | 6.0%(+4.01)#32 | 6.9%(+3.16)#4,484 |
| 3. | 58201 | 6.6% | 6.0%(+0.582)#65 | 6.9%(-0.275)#11,504 |
1
Common Questions
What are the Top Zip Codes with the Highest Percentage of Population Employed in Accommodation & Food Services in Grand Forks, ND?
Top Zip Codes with the Highest Percentage of Population Employed in Accommodation & Food Services in Grand Forks, ND are:
What zip code has the Highest Percentage of Population Employed in Accommodation & Food Services in Grand Forks, ND?
58202 has the Highest Percentage of Population Employed in Accommodation & Food Services in Grand Forks, ND with 15.5%.
What is the Percentage of Population Employed in Accommodation & Food Services in Grand Forks, ND?
Percentage of Population Employed in Accommodation & Food Services in Grand Forks is 8.3%.
What is the Percentage of Population Employed in Accommodation & Food Services in North Dakota?
Percentage of Population Employed in Accommodation & Food Services in North Dakota is 6.0%.
What is the Percentage of Population Employed in Accommodation & Food Services in the United States?
Percentage of Population Employed in Accommodation & Food Services in the United States is 6.9%.