Zip Codes with the Highest Percentage of Population Employed in Security & Protection in Laurel, MS
RELATED REPORTS & OPTIONS
Security & Protection
Laurel
Compare Zip Codes
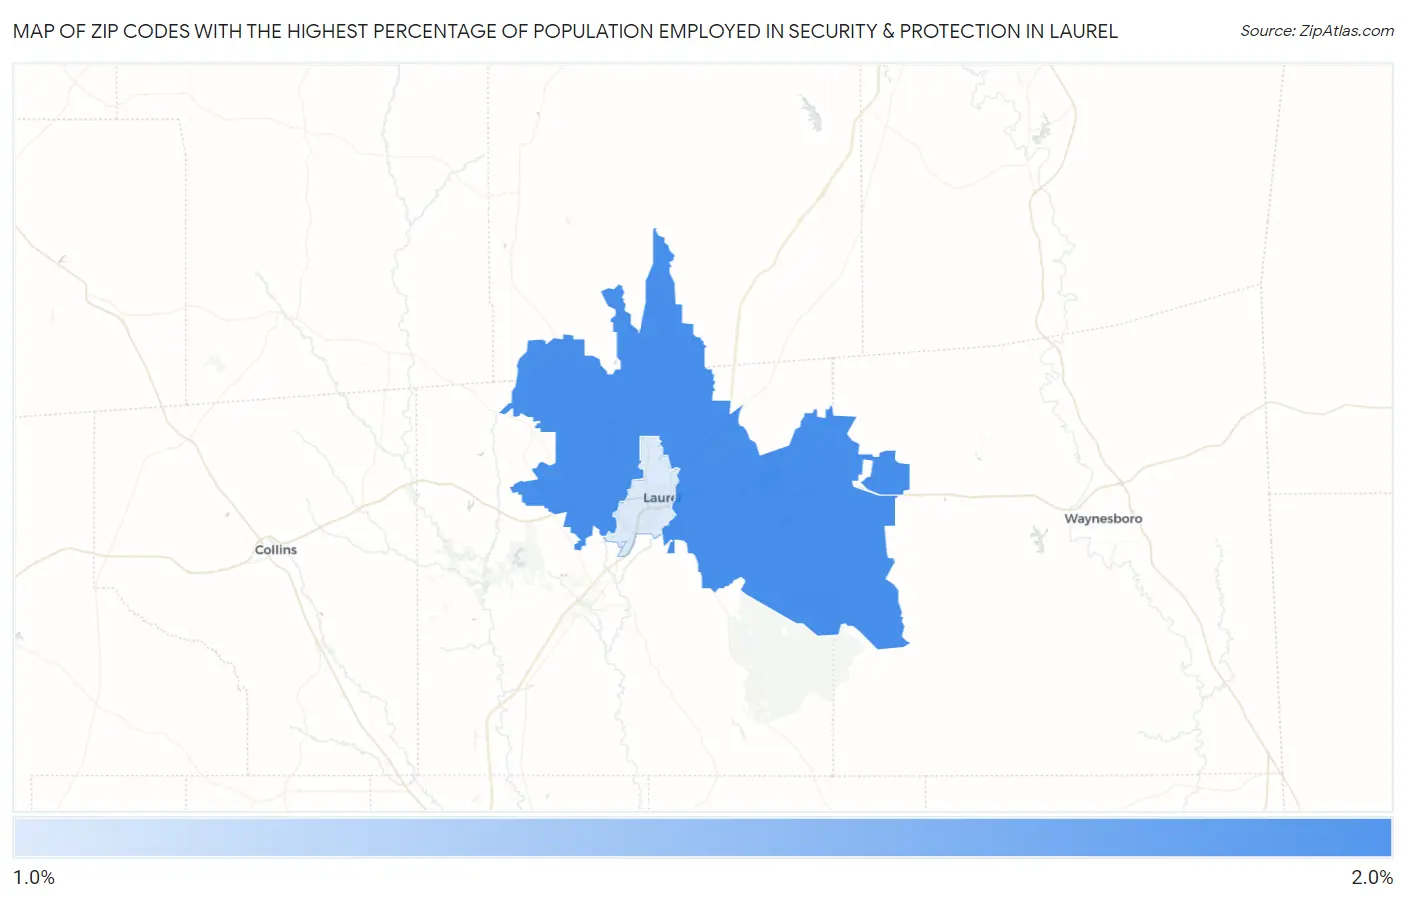
Map of Zip Codes with the Highest Percentage of Population Employed in Security & Protection in Laurel
0.0%
2.0%
Zip Codes with the Highest Percentage of Population Employed in Security & Protection in Laurel, MS
| Zip Code | % Employed | vs State | vs National | |
| 1. | 39443 | 1.8% | 2.4%(-0.623)#197 | 2.1%(-0.394)#14,267 |
| 2. | 39440 | 1.2% | 2.4%(-1.13)#232 | 2.1%(-0.902)#18,147 |
1
Common Questions
What are the Top Zip Codes with the Highest Percentage of Population Employed in Security & Protection in Laurel, MS?
Top Zip Codes with the Highest Percentage of Population Employed in Security & Protection in Laurel, MS are:
What zip code has the Highest Percentage of Population Employed in Security & Protection in Laurel, MS?
39443 has the Highest Percentage of Population Employed in Security & Protection in Laurel, MS with 1.8%.
What is the Percentage of Population Employed in Security & Protection in Laurel, MS?
Percentage of Population Employed in Security & Protection in Laurel is 1.5%.
What is the Percentage of Population Employed in Security & Protection in Mississippi?
Percentage of Population Employed in Security & Protection in Mississippi is 2.4%.
What is the Percentage of Population Employed in Security & Protection in the United States?
Percentage of Population Employed in Security & Protection in the United States is 2.1%.