Zip Codes with the Highest Percentage of Population Employed in Security & Protection in Jackson, MS
RELATED REPORTS & OPTIONS
Security & Protection
Jackson
Compare Zip Codes
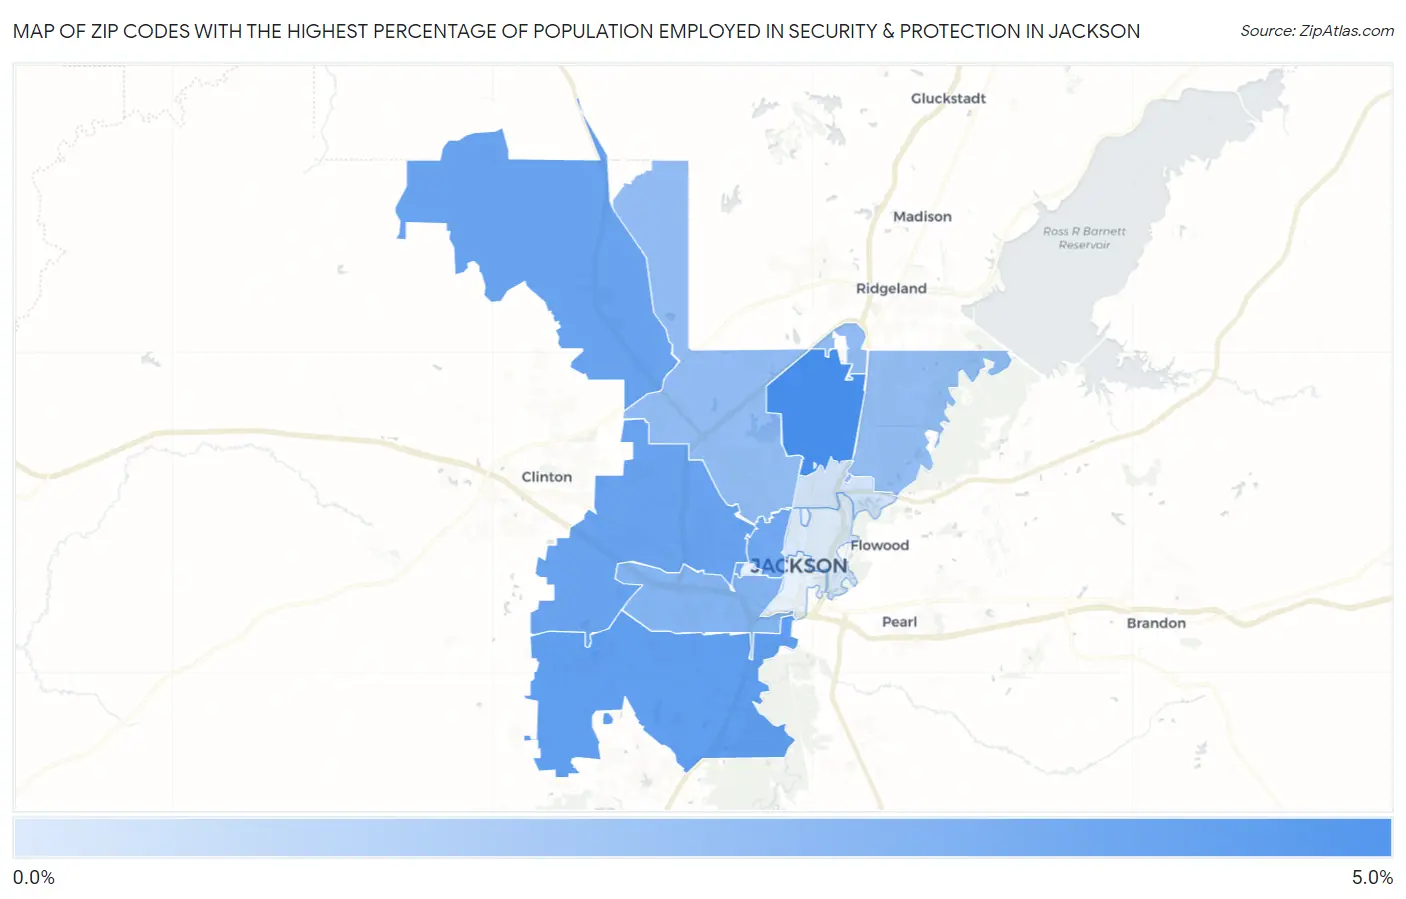
Map of Zip Codes with the Highest Percentage of Population Employed in Security & Protection in Jackson
0.0%
5.0%
Zip Codes with the Highest Percentage of Population Employed in Security & Protection in Jackson, MS
| Zip Code | % Employed | vs State | vs National | |
| 1. | 39206 | 4.3% | 2.4%(+1.93)#73 | 2.1%(+2.16)#3,940 |
| 2. | 39212 | 3.7% | 2.4%(+1.29)#89 | 2.1%(+1.52)#5,225 |
| 3. | 39209 | 3.5% | 2.4%(+1.16)#95 | 2.1%(+1.39)#5,589 |
| 4. | 39203 | 3.3% | 2.4%(+0.904)#105 | 2.1%(+1.13)#6,300 |
| 5. | 39204 | 2.9% | 2.4%(+0.499)#121 | 2.1%(+0.728)#7,748 |
| 6. | 39213 | 2.5% | 2.4%(+0.118)#146 | 2.1%(+0.348)#9,530 |
| 7. | 39211 | 2.4% | 2.4%(+0.071)#151 | 2.1%(+0.300)#9,791 |
| 8. | 39216 | 0.99% | 2.4%(-1.39)#251 | 2.1%(-1.16)#20,165 |
| 9. | 39202 | 0.70% | 2.4%(-1.68)#268 | 2.1%(-1.45)#22,071 |
1
Common Questions
What are the Top 10 Zip Codes with the Highest Percentage of Population Employed in Security & Protection in Jackson, MS?
Top 10 Zip Codes with the Highest Percentage of Population Employed in Security & Protection in Jackson, MS are:
What zip code has the Highest Percentage of Population Employed in Security & Protection in Jackson, MS?
39206 has the Highest Percentage of Population Employed in Security & Protection in Jackson, MS with 4.3%.
What is the Percentage of Population Employed in Security & Protection in Jackson, MS?
Percentage of Population Employed in Security & Protection in Jackson is 3.0%.
What is the Percentage of Population Employed in Security & Protection in Mississippi?
Percentage of Population Employed in Security & Protection in Mississippi is 2.4%.
What is the Percentage of Population Employed in Security & Protection in the United States?
Percentage of Population Employed in Security & Protection in the United States is 2.1%.