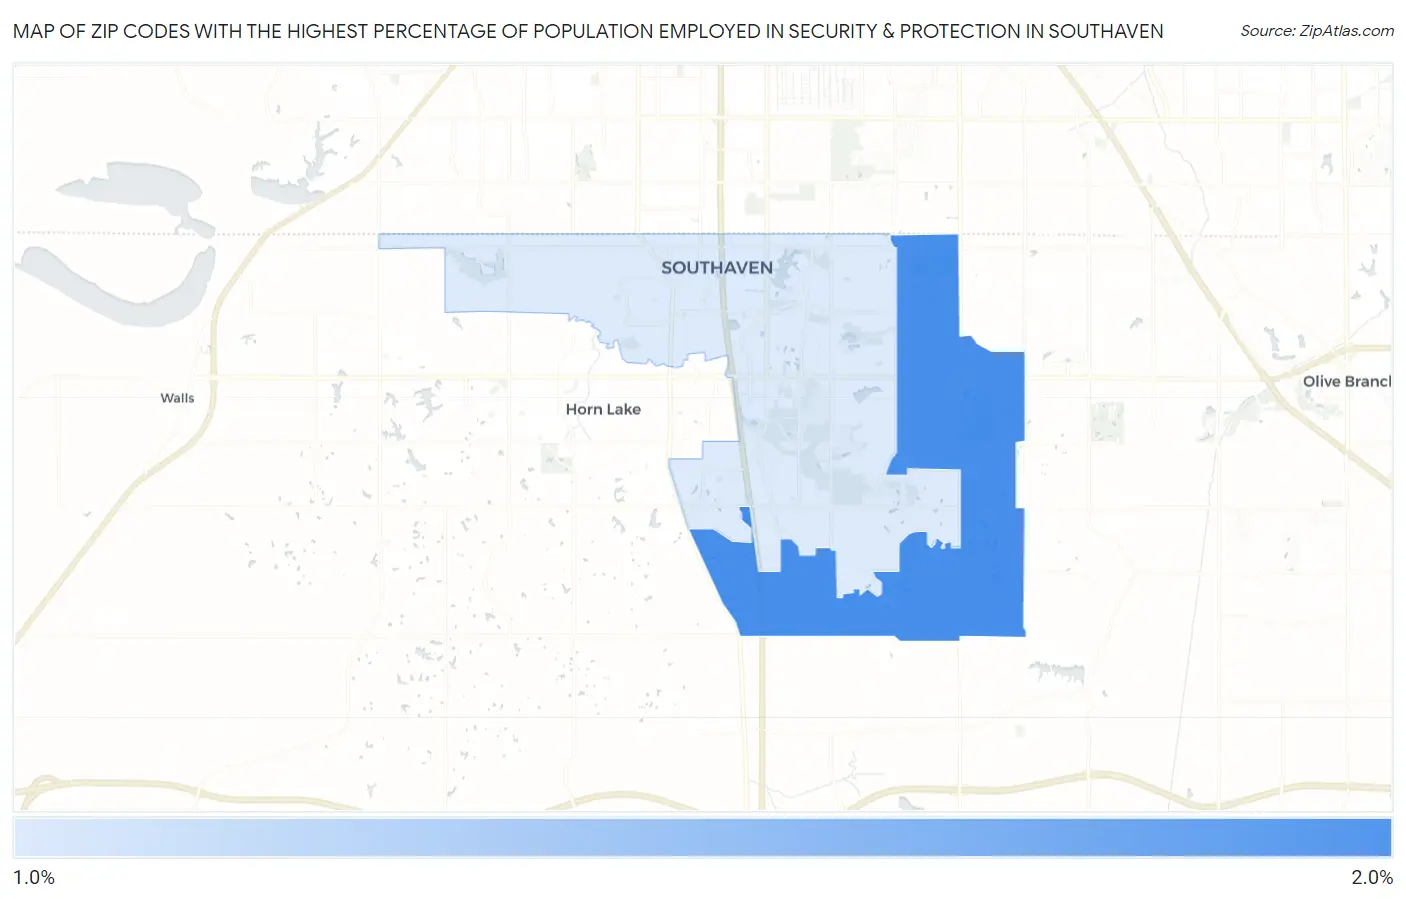
Zip Codes with the Highest Percentage of Population Employed in Security & Protection in Southaven, MS
RELATED REPORTS & OPTIONS
Security & Protection
Southaven
Compare Zip Codes
Map of Zip Codes with the Highest Percentage of Population Employed in Security & Protection in Southaven
0.0%
2.0%
Zip Codes with the Highest Percentage of Population Employed in Security & Protection in Southaven, MS
| Zip Code | % Employed | vs State | vs National | |
| 1. | 38672 | 1.9% | 2.4%(-0.481)#183 | 2.1%(-0.252)#13,240 |
| 2. | 38671 | 1.2% | 2.4%(-1.15)#235 | 2.1%(-0.924)#18,321 |
1
Common Questions
What are the Top Zip Codes with the Highest Percentage of Population Employed in Security & Protection in Southaven, MS?
Top Zip Codes with the Highest Percentage of Population Employed in Security & Protection in Southaven, MS are:
What zip code has the Highest Percentage of Population Employed in Security & Protection in Southaven, MS?
38672 has the Highest Percentage of Population Employed in Security & Protection in Southaven, MS with 1.9%.
What is the Percentage of Population Employed in Security & Protection in Southaven, MS?
Percentage of Population Employed in Security & Protection in Southaven is 1.4%.
What is the Percentage of Population Employed in Security & Protection in Mississippi?
Percentage of Population Employed in Security & Protection in Mississippi is 2.4%.
What is the Percentage of Population Employed in Security & Protection in the United States?
Percentage of Population Employed in Security & Protection in the United States is 2.1%.