Zip Codes with the Highest Percentage of Population Employed in Security & Protection in Pascagoula, MS
RELATED REPORTS & OPTIONS
Security & Protection
Pascagoula
Compare Zip Codes
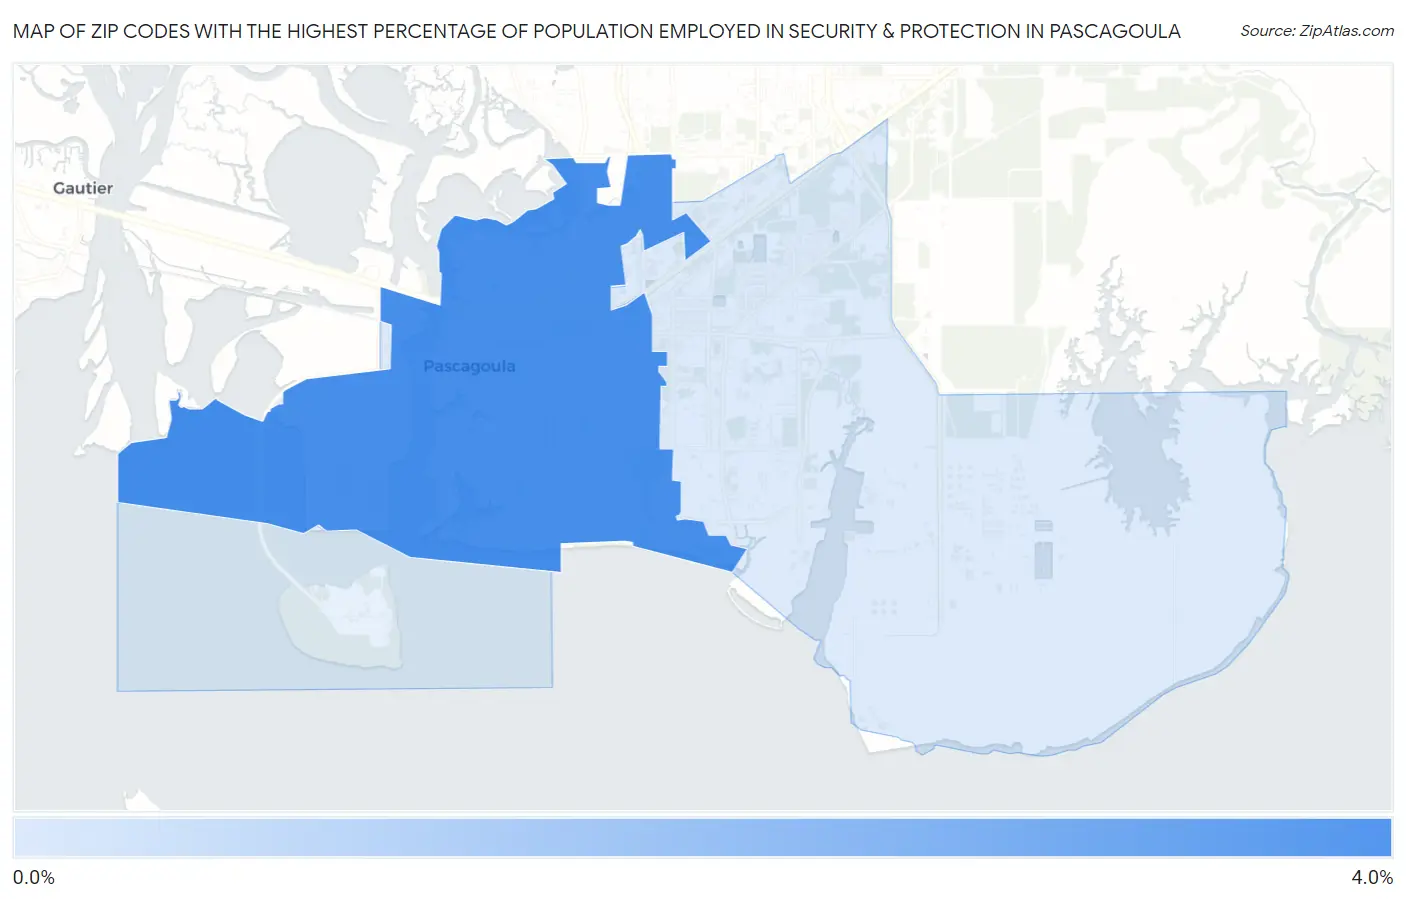
Map of Zip Codes with the Highest Percentage of Population Employed in Security & Protection in Pascagoula
0.0%
4.0%
Zip Codes with the Highest Percentage of Population Employed in Security & Protection in Pascagoula, MS
| Zip Code | % Employed | vs State | vs National | |
| 1. | 39567 | 3.9% | 2.4%(+1.48)#84 | 2.1%(+1.71)#4,778 |
| 2. | 39581 | 0.66% | 2.4%(-1.72)#273 | 2.1%(-1.49)#22,341 |
1
Common Questions
What are the Top Zip Codes with the Highest Percentage of Population Employed in Security & Protection in Pascagoula, MS?
Top Zip Codes with the Highest Percentage of Population Employed in Security & Protection in Pascagoula, MS are:
What zip code has the Highest Percentage of Population Employed in Security & Protection in Pascagoula, MS?
39567 has the Highest Percentage of Population Employed in Security & Protection in Pascagoula, MS with 3.9%.
What is the Percentage of Population Employed in Security & Protection in Pascagoula, MS?
Percentage of Population Employed in Security & Protection in Pascagoula is 2.0%.
What is the Percentage of Population Employed in Security & Protection in Mississippi?
Percentage of Population Employed in Security & Protection in Mississippi is 2.4%.
What is the Percentage of Population Employed in Security & Protection in the United States?
Percentage of Population Employed in Security & Protection in the United States is 2.1%.