Zip Codes with the Highest Percentage of Population Employed in Accommodation & Food Services in Laurel, MS
RELATED REPORTS & OPTIONS
Accommodation & Food Services
Laurel
Compare Zip Codes
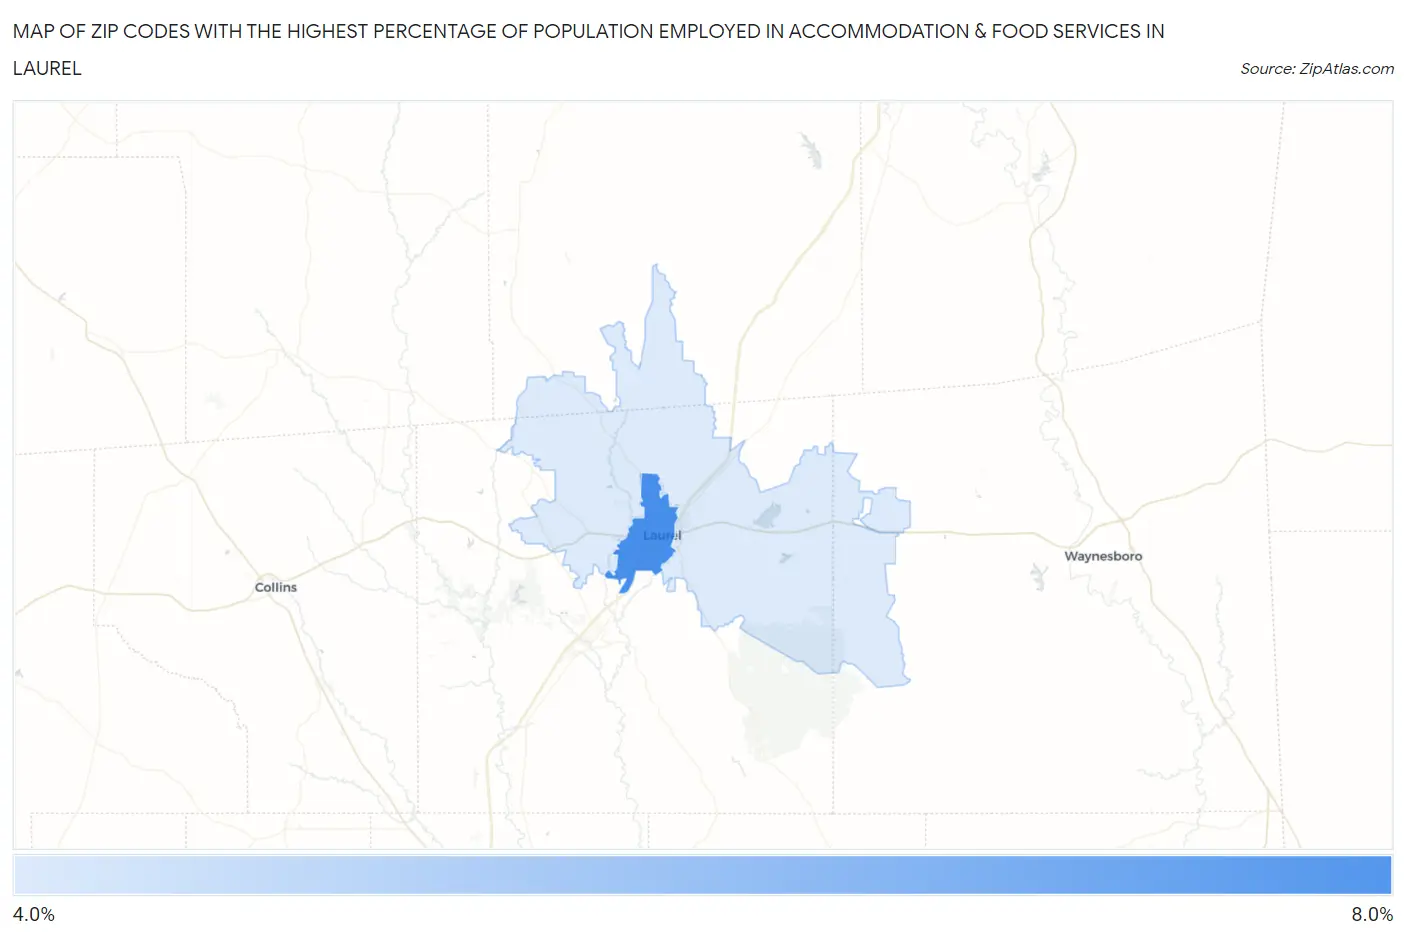
Map of Zip Codes with the Highest Percentage of Population Employed in Accommodation & Food Services in Laurel
0.0%
8.0%
Zip Codes with the Highest Percentage of Population Employed in Accommodation & Food Services in Laurel, MS
| Zip Code | % Employed | vs State | vs National | |
| 1. | 39440 | 7.9% | 6.9%(+0.970)#97 | 6.9%(+0.997)#8,079 |
| 2. | 39443 | 4.2% | 6.9%(-2.73)#226 | 6.9%(-2.70)#19,567 |
1
Common Questions
What are the Top Zip Codes with the Highest Percentage of Population Employed in Accommodation & Food Services in Laurel, MS?
Top Zip Codes with the Highest Percentage of Population Employed in Accommodation & Food Services in Laurel, MS are:
What zip code has the Highest Percentage of Population Employed in Accommodation & Food Services in Laurel, MS?
39440 has the Highest Percentage of Population Employed in Accommodation & Food Services in Laurel, MS with 7.9%.
What is the Percentage of Population Employed in Accommodation & Food Services in Laurel, MS?
Percentage of Population Employed in Accommodation & Food Services in Laurel is 9.2%.
What is the Percentage of Population Employed in Accommodation & Food Services in Mississippi?
Percentage of Population Employed in Accommodation & Food Services in Mississippi is 6.9%.
What is the Percentage of Population Employed in Accommodation & Food Services in the United States?
Percentage of Population Employed in Accommodation & Food Services in the United States is 6.9%.