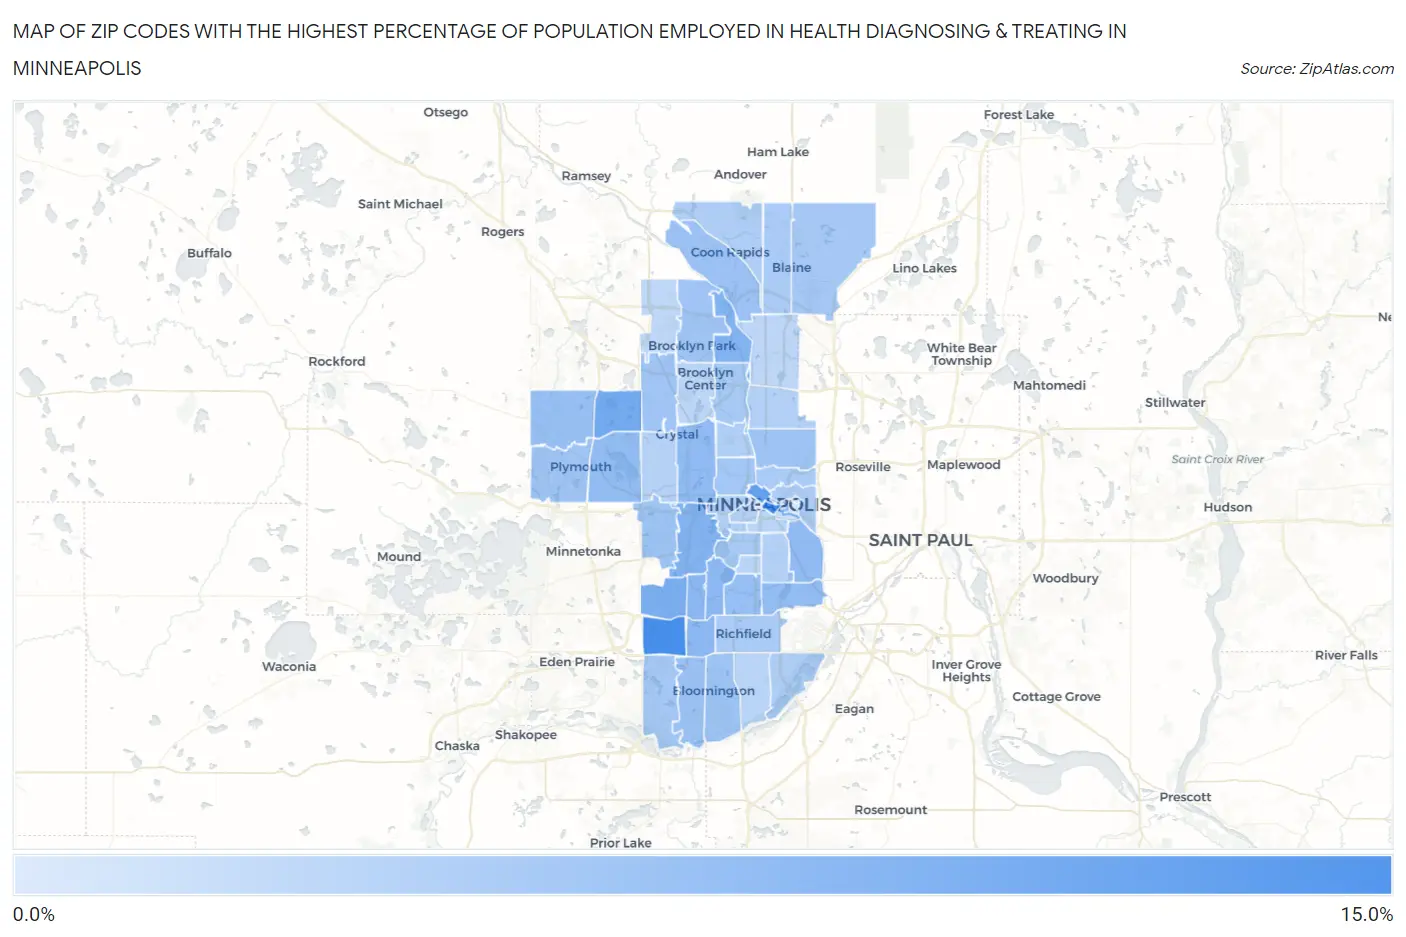
Zip Codes with the Highest Percentage of Population Employed in Health Diagnosing & Treating in Minneapolis, MN
RELATED REPORTS & OPTIONS
Health Diagnosing & Treating
Minneapolis
Compare Zip Codes
Map of Zip Codes with the Highest Percentage of Population Employed in Health Diagnosing & Treating in Minneapolis
0.0%
15.0%
Zip Codes with the Highest Percentage of Population Employed in Health Diagnosing & Treating in Minneapolis, MN
| Zip Code | % Employed | vs State | vs National | |
| 1. | 55439 | 14.3% | 6.8%(+7.55)#17 | 6.2%(+8.07)#1,313 |
| 2. | 55415 | 14.2% | 6.8%(+7.43)#20 | 6.2%(+7.95)#1,356 |
| 3. | 55401 | 11.4% | 6.8%(+4.62)#44 | 6.2%(+5.14)#2,603 |
| 4. | 55442 | 10.0% | 6.8%(+3.20)#89 | 6.2%(+3.72)#3,939 |
| 5. | 55436 | 9.4% | 6.8%(+2.59)#117 | 6.2%(+3.11)#4,753 |
| 6. | 55444 | 8.7% | 6.8%(+1.93)#141 | 6.2%(+2.45)#5,937 |
| 7. | 55416 | 8.7% | 6.8%(+1.90)#143 | 6.2%(+2.42)#5,998 |
| 8. | 55410 | 8.0% | 6.8%(+1.23)#178 | 6.2%(+1.74)#7,533 |
| 9. | 55424 | 8.0% | 6.8%(+1.21)#180 | 6.2%(+1.73)#7,570 |
| 10. | 55435 | 7.9% | 6.8%(+1.16)#191 | 6.2%(+1.68)#7,708 |
| 11. | 55406 | 7.5% | 6.8%(+0.775)#220 | 6.2%(+1.29)#8,695 |
| 12. | 55422 | 7.5% | 6.8%(+0.771)#221 | 6.2%(+1.29)#8,708 |
| 13. | 55441 | 7.3% | 6.8%(+0.494)#253 | 6.2%(+1.01)#9,534 |
| 14. | 55417 | 7.2% | 6.8%(+0.401)#266 | 6.2%(+0.918)#9,831 |
| 15. | 55419 | 6.9% | 6.8%(+0.115)#307 | 6.2%(+0.632)#10,756 |
| 16. | 55446 | 6.8% | 6.8%(+0.033)#313 | 6.2%(+0.550)#11,009 |
| 17. | 55437 | 6.4% | 6.8%(-0.319)#358 | 6.2%(+0.198)#12,230 |
| 18. | 55433 | 6.4% | 6.8%(-0.379)#364 | 6.2%(+0.138)#12,435 |
| 19. | 55426 | 6.3% | 6.8%(-0.484)#369 | 6.2%(+0.033)#12,847 |
| 20. | 55418 | 6.2% | 6.8%(-0.536)#377 | 6.2%(-0.019)#13,063 |
| 21. | 55431 | 6.2% | 6.8%(-0.590)#383 | 6.2%(-0.073)#13,259 |
| 22. | 55443 | 6.0% | 6.8%(-0.731)#399 | 6.2%(-0.214)#13,765 |
| 23. | 55428 | 6.0% | 6.8%(-0.777)#406 | 6.2%(-0.260)#13,930 |
| 24. | 55447 | 6.0% | 6.8%(-0.795)#410 | 6.2%(-0.278)#13,994 |
| 25. | 55411 | 5.8% | 6.8%(-1.01)#434 | 6.2%(-0.491)#14,782 |
| 26. | 55449 | 5.6% | 6.8%(-1.18)#458 | 6.2%(-0.659)#15,451 |
| 27. | 55438 | 5.6% | 6.8%(-1.18)#460 | 6.2%(-0.661)#15,460 |
| 28. | 55408 | 5.4% | 6.8%(-1.35)#488 | 6.2%(-0.835)#16,125 |
| 29. | 55430 | 5.4% | 6.8%(-1.38)#494 | 6.2%(-0.864)#16,239 |
| 30. | 55423 | 5.3% | 6.8%(-1.51)#514 | 6.2%(-0.991)#16,733 |
| 31. | 55434 | 5.2% | 6.8%(-1.55)#520 | 6.2%(-1.03)#16,890 |
| 32. | 55413 | 5.2% | 6.8%(-1.58)#523 | 6.2%(-1.06)#17,002 |
| 33. | 55414 | 5.1% | 6.8%(-1.70)#539 | 6.2%(-1.18)#17,436 |
| 34. | 55448 | 4.8% | 6.8%(-1.96)#570 | 6.2%(-1.44)#18,491 |
| 35. | 55425 | 4.8% | 6.8%(-1.97)#573 | 6.2%(-1.46)#18,538 |
| 36. | 55412 | 4.6% | 6.8%(-2.12)#589 | 6.2%(-1.61)#19,104 |
| 37. | 55407 | 4.5% | 6.8%(-2.28)#607 | 6.2%(-1.76)#19,691 |
| 38. | 55421 | 4.5% | 6.8%(-2.30)#611 | 6.2%(-1.79)#19,781 |
| 39. | 55405 | 4.4% | 6.8%(-2.32)#616 | 6.2%(-1.80)#19,864 |
| 40. | 55427 | 4.2% | 6.8%(-2.57)#643 | 6.2%(-2.05)#20,732 |
| 41. | 55403 | 4.1% | 6.8%(-2.65)#657 | 6.2%(-2.14)#21,036 |
| 42. | 55404 | 3.9% | 6.8%(-2.87)#679 | 6.2%(-2.35)#21,709 |
| 43. | 55420 | 3.8% | 6.8%(-2.93)#683 | 6.2%(-2.42)#21,909 |
| 44. | 55409 | 3.7% | 6.8%(-3.06)#694 | 6.2%(-2.54)#22,276 |
| 45. | 55429 | 3.7% | 6.8%(-3.08)#698 | 6.2%(-2.56)#22,334 |
| 46. | 55432 | 3.6% | 6.8%(-3.20)#709 | 6.2%(-2.68)#22,729 |
| 47. | 55445 | 3.4% | 6.8%(-3.39)#732 | 6.2%(-2.87)#23,262 |
| 48. | 55454 | 2.3% | 6.8%(-4.41)#802 | 6.2%(-3.90)#25,822 |
| 49. | 55455 | 0.84% | 6.8%(-5.92)#837 | 6.2%(-5.40)#28,011 |
1
Common Questions
What are the Top 10 Zip Codes with the Highest Percentage of Population Employed in Health Diagnosing & Treating in Minneapolis, MN?
Top 10 Zip Codes with the Highest Percentage of Population Employed in Health Diagnosing & Treating in Minneapolis, MN are:
What zip code has the Highest Percentage of Population Employed in Health Diagnosing & Treating in Minneapolis, MN?
55439 has the Highest Percentage of Population Employed in Health Diagnosing & Treating in Minneapolis, MN with 14.3%.
What is the Percentage of Population Employed in Health Diagnosing & Treating in Minneapolis, MN?
Percentage of Population Employed in Health Diagnosing & Treating in Minneapolis is 5.9%.
What is the Percentage of Population Employed in Health Diagnosing & Treating in Minnesota?
Percentage of Population Employed in Health Diagnosing & Treating in Minnesota is 6.8%.
What is the Percentage of Population Employed in Health Diagnosing & Treating in the United States?
Percentage of Population Employed in Health Diagnosing & Treating in the United States is 6.2%.