Zip Codes with the Highest Percentage of Households Without a Vehicle in Minneapolis, MN

RELATED REPORTS & OPTIONS

Households without a Cars
Population
Families and Households
Female Fertility
Female Fertility (Unmarried)
Race (Community Size)
Race (Percentage)
Ancestry (Community Size)
AfghanAfricanAlaska NativeAlbanianAlsatianAmericanApacheArabArgentineanArmenianAssyrian / Chaldean / SyriacAustralianAustrianBahamianBangladeshiBarbadianBasqueBelgianBelizeanBhutaneseBlackfeetBolivianBrazilianBritishBritish West IndianBulgarianBurmeseCajunCambodianCanadianCape VerdeanCarpatho RusynCelticCentral AmericanCentral American IndianCherokeeCheyenneChickasawChileanChippewaChoctawColombianComancheCosta RicanCreeCreekCroatianCrowCubanCypriotCzechCzechoslovakianDanishDominicanDutchEastern EuropeanEcuadorianEgyptianEnglishEstonianEthiopianEuropeanFijianFilipinoFinnishFrenchFrench American IndianFrench CanadianGermanGerman RussianGhanaianGreekGuamanian / ChamorroGuatemalanGuyaneseHaitianHonduranHungarianIcelanderIndian (Asian)IndonesianInupiatIranianIraqiIrishIroquoisIsraeliItalianJamaicanJapaneseJordanianKenyanKoreanLaotianLatvianLebaneseLiberianLithuanianLuxembourgerMacedonianMalaysianMalteseMenomineeMexicanMexican American IndianMongolianMoroccanNative HawaiianNavajoNicaraguanNigerianNorthern EuropeanNorwegianOkinawanOsagePakistaniPalestinianPanamanianParaguayanPennsylvania GermanPeruvianPolishPortuguesePotawatomiPuerto RicanRomanianRussianSalvadoranSamoanScandinavianScotch-IrishScottishSenegaleseSerbianSierra LeoneanSiouxSlavicSlovakSloveneSomaliSouth AfricanSouth AmericanSouth American IndianSoviet UnionSpaniardSpanishSri LankanSubsaharan AfricanSudaneseSwedishSwissSyrianThaiTonganTrinidadian and TobagonianTurkishUgandanUkrainianUruguayanVenezuelanVietnameseWelshWest IndianYugoslavian
Ancestry (Percentage)
AfghanAfricanAlaska NativeAlbanianAlsatianAmericanApacheArabArgentineanArmenianAssyrian / Chaldean / SyriacAustralianAustrianBahamianBangladeshiBarbadianBasqueBelgianBelizeanBhutaneseBlackfeetBolivianBrazilianBritishBritish West IndianBulgarianBurmeseCajunCambodianCanadianCape VerdeanCarpatho RusynCelticCentral AmericanCentral American IndianCherokeeCheyenneChickasawChileanChippewaChoctawColombianComancheCosta RicanCreeCreekCroatianCrowCubanCypriotCzechCzechoslovakianDanishDominicanDutchEastern EuropeanEcuadorianEgyptianEnglishEstonianEthiopianEuropeanFijianFilipinoFinnishFrenchFrench American IndianFrench CanadianGermanGerman RussianGhanaianGreekGuamanian / ChamorroGuatemalanGuyaneseHaitianHonduranHungarianIcelanderIndian (Asian)IndonesianInupiatIranianIraqiIrishIroquoisIsraeliItalianJamaicanJapaneseJordanianKenyanKoreanLaotianLatvianLebaneseLiberianLithuanianLuxembourgerMacedonianMalaysianMalteseMenomineeMexicanMexican American IndianMongolianMoroccanNative HawaiianNavajoNicaraguanNigerianNorthern EuropeanNorwegianOkinawanOsagePakistaniPalestinianPanamanianParaguayanPennsylvania GermanPeruvianPolishPortuguesePotawatomiPuerto RicanRomanianRussianSalvadoranSamoanScandinavianScotch-IrishScottishSenegaleseSerbianSierra LeoneanSiouxSlavicSlovakSloveneSomaliSouth AfricanSouth AmericanSouth American IndianSoviet UnionSpaniardSpanishSri LankanSubsaharan AfricanSudaneseSwedishSwissSyrianThaiTonganTrinidadian and TobagonianTurkishUgandanUkrainianUruguayanVenezuelanVietnameseWelshWest IndianYugoslavian
Immigrant Origin (Total)
AfghanistanAfricaAlbaniaArgentinaAsiaAustraliaAustriaBahamasBangladeshBarbadosBelarusBelgiumBelizeBoliviaBosnia and HerzegovinaBrazilBulgariaBurma / MyanmarCabo VerdeCambodiaCameroonCanadaCaribbeanCentral AmericaChileChinaColombiaCongoCosta RicaCroatiaCubaCzechoslovakiaDenmarkDominican RepublicEastern AfricaEastern AsiaEastern EuropeEcuadorEgyptEl SalvadorEnglandEritreaEthiopiaEuropeFranceGermanyGhanaGreeceGuatemalaGuyanaHaitiHondurasHong KongHungaryIndiaIndonesiaIranIraqIrelandIsraelItalyJamaicaJapanJordanKazakhstanKenyaKoreaKuwaitLaosLatin AmericaLatviaLebanonLiberiaLithuaniaMalaysiaMexicoMicronesiaMiddle AfricaMoldovaMoroccoNepalNetherlandsNicaraguaNigeriaNorthern AfricaNorthern EuropeNorwayOceaniaPakistanPanamaPeruPhilippinesPolandRomaniaRussiaSaudi ArabiaScotlandSenegalSerbiaSierra LeoneSingaporeSomaliaSouth AfricaSouth AmericaSouth Central AsiaSouth Eastern AsiaSouthern EuropeSpainSri LankaSudanSwedenSwitzerlandSyriaTaiwanThailandTrinidad and TobagoTurkeyUgandaUkraineUruguayUzbekistanVenezuelaVietnamWestern AfricaWestern AsiaWestern EuropeYemenZaireZimbabwe
Immigrant Origin (Percentage)
AfghanistanAfricaAlbaniaArgentinaAsiaAustraliaAustriaBahamasBangladeshBarbadosBelarusBelgiumBelizeBoliviaBosnia and HerzegovinaBrazilBulgariaBurma / MyanmarCabo VerdeCambodiaCameroonCanadaCaribbeanCentral AmericaChileChinaColombiaCongoCosta RicaCroatiaCubaCzechoslovakiaDenmarkDominican RepublicEastern AfricaEastern AsiaEastern EuropeEcuadorEgyptEl SalvadorEnglandEritreaEthiopiaEuropeFranceGermanyGhanaGreeceGuatemalaGuyanaHaitiHondurasHong KongHungaryIndiaIndonesiaIranIraqIrelandIsraelItalyJamaicaJapanJordanKazakhstanKenyaKoreaKuwaitLaosLatin AmericaLatviaLebanonLiberiaLithuaniaMalaysiaMexicoMicronesiaMiddle AfricaMoldovaMoroccoNepalNetherlandsNicaraguaNigeriaNorthern AfricaNorthern EuropeNorwayOceaniaPakistanPanamaPeruPhilippinesPolandRomaniaRussiaSaudi ArabiaScotlandSenegalSerbiaSierra LeoneSingaporeSomaliaSouth AfricaSouth AmericaSouth Central AsiaSouth Eastern AsiaSouthern EuropeSpainSri LankaSudanSwedenSwitzerlandSyriaTaiwanThailandTrinidad and TobagoTurkeyUgandaUkraineUruguayUzbekistanVenezuelaVietnamWestern AfricaWestern AsiaWestern EuropeYemenZaireZimbabwe
Income
Income (Families)
Income (Households)
Poverty
Poverty (Families)
Unemployment
Employment Occupations
Employment Industries
Employer Class
Commute Time
Commute Means
School Enrollment
Education by Degree Field
Occupancy
Finances
Physical Characteristics
Minneapolis
Compare Zip Codes
Comparison Subject

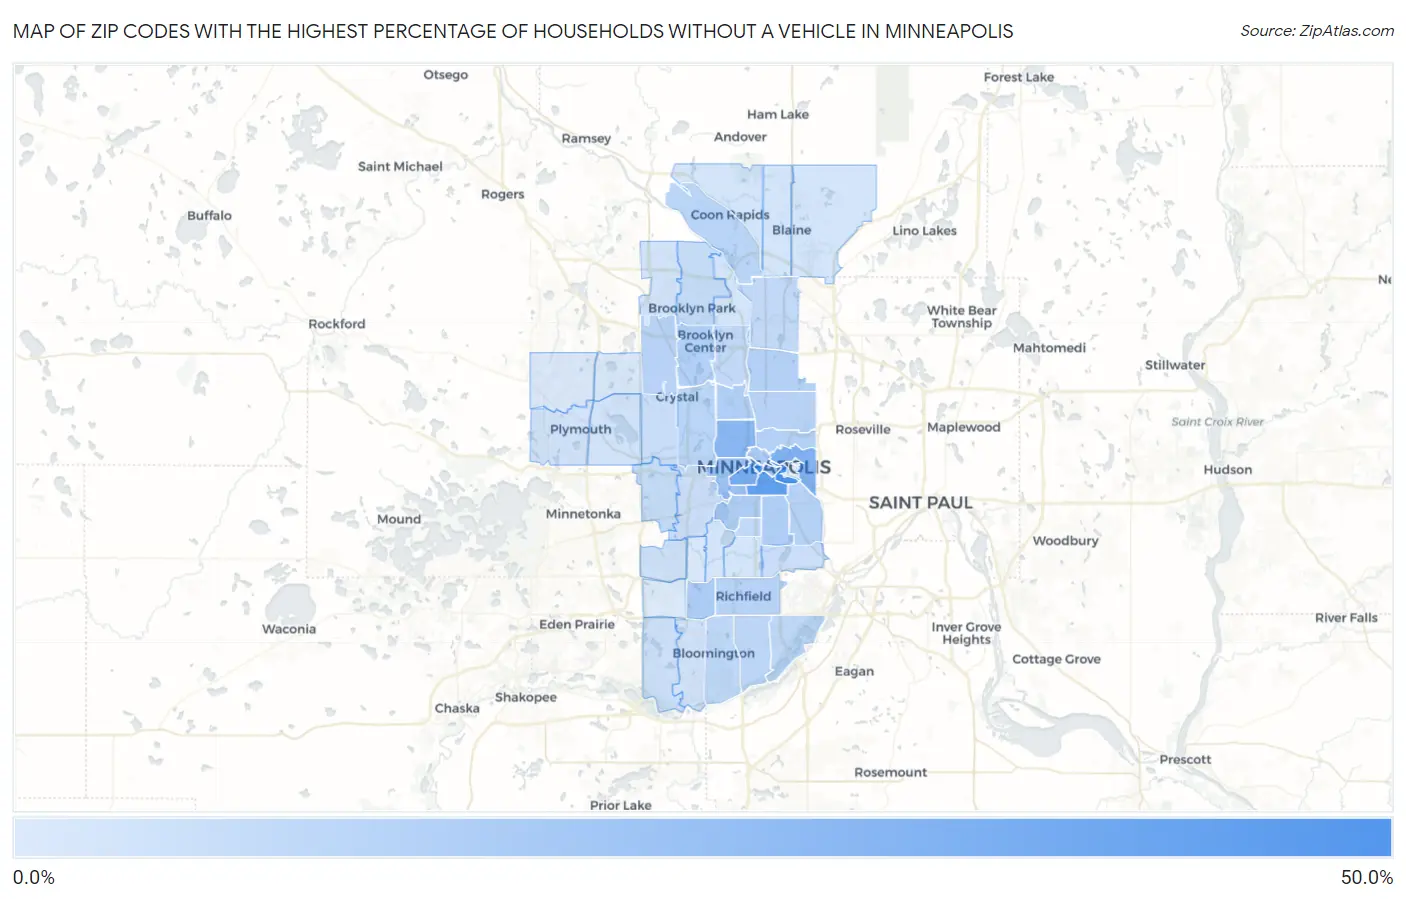
Map of Zip Codes with the Highest Percentage of Households Without a Vehicle in Minneapolis

0.0%
50.0%
Zip Codes with the Highest Percentage of Households Without a Vehicle in Minneapolis Map

Zip Codes with the Highest Percentage of Households Without a Vehicle in Minneapolis, MN

Zip Code Housholds Without a Car vs State vs National
1.5540244.3%6.6%(+37.7)#18.3%(+36.0)#419
2.5545443.3%6.6%(+36.7)#28.3%(+35.0)#440
3.5540435.0%6.6%(+28.4)#58.3%(+26.7)#636
4.5540327.9%6.6%(+21.3)#78.3%(+19.6)#894
5.5541425.8%6.6%(+19.2)#108.3%(+17.5)#1,016
6.5541123.1%6.6%(+16.5)#118.3%(+14.8)#1,203
7.5541518.8%6.6%(+12.2)#208.3%(+10.5)#1,670
8.5540518.2%6.6%(+11.6)#218.3%(+9.90)#1,750
9.5543512.8%6.6%(+6.20)#358.3%(+4.50)#3,187
10.5540112.8%6.6%(+6.20)#368.3%(+4.50)#3,188
11.5540812.7%6.6%(+6.10)#378.3%(+4.40)#3,221
12.5540711.6%6.6%(+5.00)#478.3%(+3.30)#3,754
13.5541211.6%6.6%(+5.00)#488.3%(+3.30)#3,765
14.5542911.5%6.6%(+4.90)#528.3%(+3.20)#3,822
15.5541311.5%6.6%(+4.90)#538.3%(+3.20)#3,833
16.5542111.4%6.6%(+4.80)#548.3%(+3.10)#3,886
17.5540610.6%6.6%(+4.00)#598.3%(+2.30)#4,383
18.5541810.3%6.6%(+3.70)#628.3%(+2.00)#4,624
19.5542310.1%6.6%(+3.50)#678.3%(+1.80)#4,768
20.5542810.0%6.6%(+3.40)#728.3%(+1.70)#4,851
21.554229.7%6.6%(+3.10)#768.3%(+1.40)#5,102
22.554339.3%6.6%(+2.70)#828.3%(+1.00)#5,426
23.554208.6%6.6%(+2.00)#1028.3%(+0.300)#6,190
24.554258.5%6.6%(+1.90)#1078.3%(+0.200)#6,348
25.554318.0%6.6%(+1.40)#1278.3%(-0.300)#6,932
26.554307.9%6.6%(+1.30)#1358.3%(-0.400)#7,104
27.554327.5%6.6%(+0.900)#1548.3%(-0.800)#7,695
28.554097.4%6.6%(+0.800)#1598.3%(-0.900)#7,898
29.554266.5%6.6%(-0.100)#2058.3%(-1.80)#9,401
30.554436.3%6.6%(-0.300)#2178.3%(-2.00)#9,783
31.554275.9%6.6%(-0.700)#2388.3%(-2.40)#10,693
32.554165.2%6.6%(-1.40)#2858.3%(-3.10)#12,333
33.554175.2%6.6%(-1.40)#2878.3%(-3.10)#12,357
34.554384.7%6.6%(-1.90)#3278.3%(-3.60)#13,699
35.554364.3%6.6%(-2.30)#3638.3%(-4.00)#14,848
36.554413.8%6.6%(-2.80)#4038.3%(-4.50)#16,384
37.554473.7%6.6%(-2.90)#4138.3%(-4.60)#16,700
38.554453.7%6.6%(-2.90)#4158.3%(-4.60)#16,732
39.554373.3%6.6%(-3.30)#4508.3%(-5.00)#18,031
40.554193.0%6.6%(-3.60)#4878.3%(-5.30)#19,070
41.554443.0%6.6%(-3.60)#4898.3%(-5.30)#19,109
42.554342.8%6.6%(-3.80)#5098.3%(-5.50)#19,745
43.554492.7%6.6%(-3.90)#5228.3%(-5.60)#20,090
44.554482.7%6.6%(-3.90)#5238.3%(-5.60)#20,098
45.554102.3%6.6%(-4.30)#5718.3%(-6.00)#21,404
46.554422.1%6.6%(-4.50)#5948.3%(-6.20)#22,124
47.554461.5%6.6%(-5.10)#6678.3%(-6.80)#24,103
48.554241.5%6.6%(-5.10)#6698.3%(-6.80)#24,146
49.554390.70%6.6%(-5.90)#7598.3%(-7.60)#26,384

Common Questions

What are the Top 10 Zip Codes with the Highest Percentage of Households Without a Vehicle in Minneapolis, MN?
Top 10 Zip Codes with the Highest Percentage of Households Without a Vehicle in Minneapolis, MN are:
#1
44.3%
#2
43.3%
#3
35.0%
#4
27.9%
#5
25.8%
#6
23.1%
#7
18.8%
#8
18.2%
#9
12.8%
#10
12.8%
What zip code has the Highest Percentage of Households Without a Vehicle in Minneapolis, MN?
55402 has the Highest Percentage of Households Without a Vehicle in Minneapolis, MN with 44.3%.
What is the Percentage of Households Without a Vehicle in Minneapolis, MN?
Percentage of Households Without a Vehicle in Minneapolis is 15.3%.
What is the Percentage of Households Without a Vehicle in Minnesota?
Percentage of Households Without a Vehicle in Minnesota is 6.6%.
What is the Percentage of Households Without a Vehicle in the United States?
Percentage of Households Without a Vehicle in the United States is 8.3%.