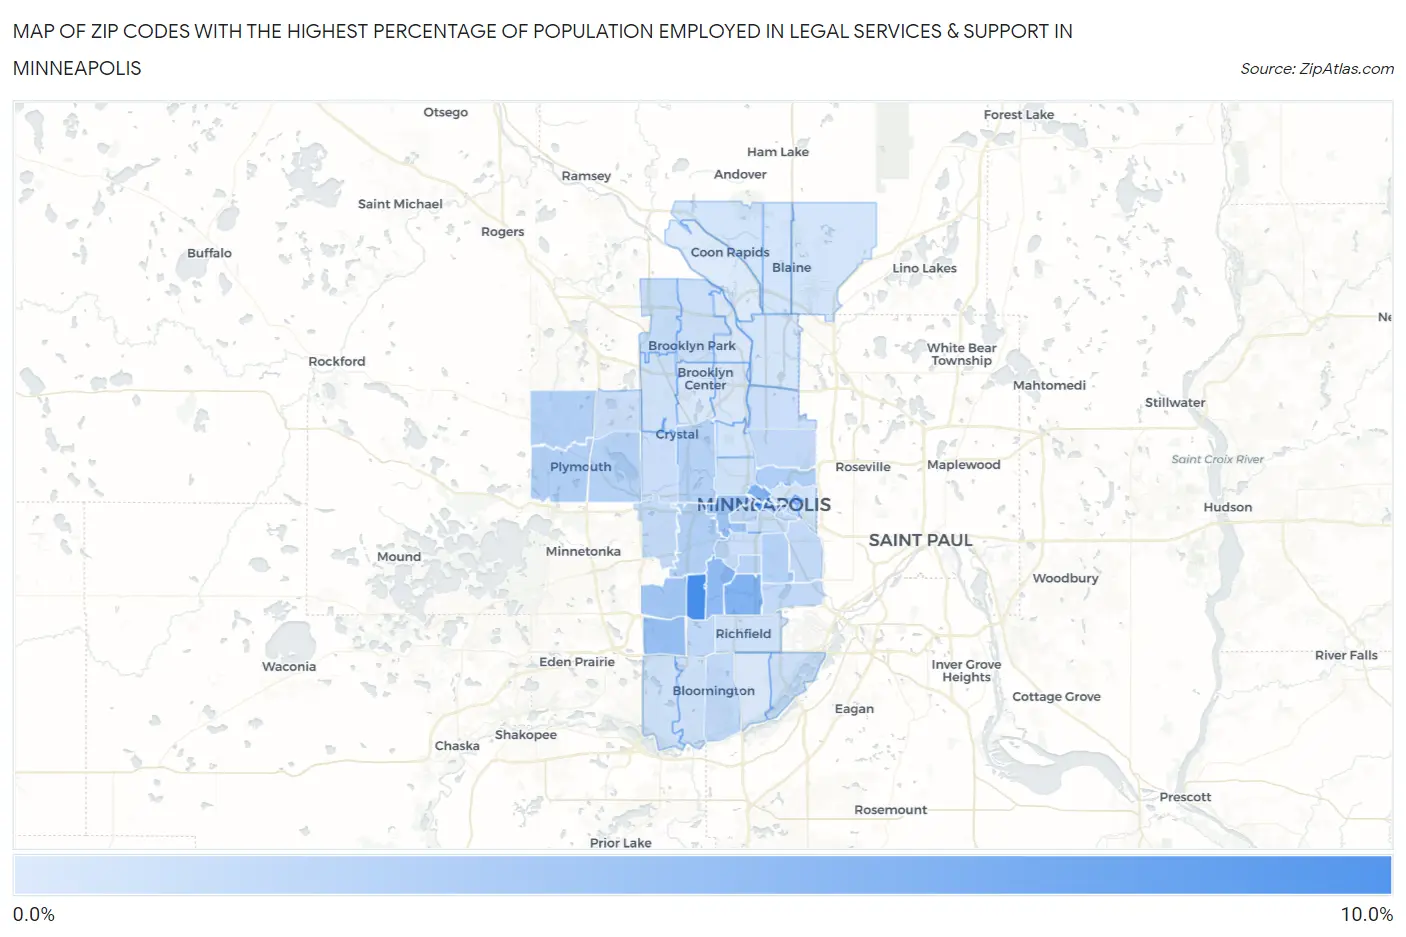
Zip Codes with the Highest Percentage of Population Employed in Legal Services & Support in Minneapolis, MN
RELATED REPORTS & OPTIONS
Legal Services & Support
Minneapolis
Compare Zip Codes
Map of Zip Codes with the Highest Percentage of Population Employed in Legal Services & Support in Minneapolis
0.0%
10.0%
Zip Codes with the Highest Percentage of Population Employed in Legal Services & Support in Minneapolis, MN
| Zip Code | % Employed | vs State | vs National | |
| 1. | 55424 | 8.2% | 1.0%(+7.20)#2 | 1.2%(+7.05)#244 |
| 2. | 55402 | 8.0% | 1.0%(+6.98)#3 | 1.2%(+6.83)#264 |
| 3. | 55419 | 5.1% | 1.0%(+4.07)#5 | 1.2%(+3.92)#691 |
| 4. | 55401 | 5.0% | 1.0%(+3.93)#6 | 1.2%(+3.78)#727 |
| 5. | 55410 | 4.2% | 1.0%(+3.18)#13 | 1.2%(+3.03)#1,015 |
| 6. | 55439 | 3.8% | 1.0%(+2.81)#16 | 1.2%(+2.66)#1,208 |
| 7. | 55405 | 3.4% | 1.0%(+2.42)#18 | 1.2%(+2.26)#1,475 |
| 8. | 55436 | 3.2% | 1.0%(+2.22)#20 | 1.2%(+2.06)#1,611 |
| 9. | 55415 | 2.9% | 1.0%(+1.84)#23 | 1.2%(+1.68)#2,006 |
| 10. | 55413 | 2.5% | 1.0%(+1.52)#29 | 1.2%(+1.36)#2,441 |
| 11. | 55447 | 2.4% | 1.0%(+1.38)#36 | 1.2%(+1.23)#2,653 |
| 12. | 55416 | 2.4% | 1.0%(+1.35)#38 | 1.2%(+1.20)#2,701 |
| 13. | 55446 | 2.4% | 1.0%(+1.32)#39 | 1.2%(+1.17)#2,747 |
| 14. | 55422 | 2.4% | 1.0%(+1.32)#40 | 1.2%(+1.17)#2,754 |
| 15. | 55407 | 2.3% | 1.0%(+1.26)#43 | 1.2%(+1.11)#2,856 |
| 16. | 55441 | 2.2% | 1.0%(+1.20)#45 | 1.2%(+1.05)#2,971 |
| 17. | 55409 | 2.1% | 1.0%(+1.12)#48 | 1.2%(+0.966)#3,139 |
| 18. | 55403 | 1.8% | 1.0%(+0.816)#65 | 1.2%(+0.664)#3,872 |
| 19. | 55435 | 1.8% | 1.0%(+0.772)#67 | 1.2%(+0.620)#3,993 |
| 20. | 55431 | 1.7% | 1.0%(+0.717)#70 | 1.2%(+0.565)#4,148 |
| 21. | 55406 | 1.7% | 1.0%(+0.697)#72 | 1.2%(+0.545)#4,214 |
| 22. | 55454 | 1.7% | 1.0%(+0.681)#73 | 1.2%(+0.529)#4,282 |
| 23. | 55417 | 1.7% | 1.0%(+0.676)#74 | 1.2%(+0.523)#4,293 |
| 24. | 55418 | 1.7% | 1.0%(+0.670)#76 | 1.2%(+0.518)#4,310 |
| 25. | 55426 | 1.6% | 1.0%(+0.573)#83 | 1.2%(+0.420)#4,662 |
| 26. | 55445 | 1.5% | 1.0%(+0.478)#91 | 1.2%(+0.325)#5,013 |
| 27. | 55404 | 1.3% | 1.0%(+0.250)#117 | 1.2%(+0.098)#6,031 |
| 28. | 55442 | 1.3% | 1.0%(+0.222)#120 | 1.2%(+0.070)#6,184 |
| 29. | 55408 | 1.3% | 1.0%(+0.221)#121 | 1.2%(+0.068)#6,200 |
| 30. | 55427 | 1.2% | 1.0%(+0.210)#123 | 1.2%(+0.057)#6,261 |
| 31. | 55421 | 1.2% | 1.0%(+0.207)#125 | 1.2%(+0.055)#6,275 |
| 32. | 55425 | 1.1% | 1.0%(+0.100)#138 | 1.2%(-0.053)#6,932 |
| 33. | 55455 | 1.1% | 1.0%(+0.094)#140 | 1.2%(-0.058)#6,978 |
| 34. | 55443 | 1.1% | 1.0%(+0.064)#143 | 1.2%(-0.088)#7,196 |
| 35. | 55411 | 0.99% | 1.0%(-0.040)#160 | 1.2%(-0.192)#7,882 |
| 36. | 55423 | 0.98% | 1.0%(-0.051)#163 | 1.2%(-0.203)#7,957 |
| 37. | 55438 | 0.96% | 1.0%(-0.071)#167 | 1.2%(-0.224)#8,126 |
| 38. | 55428 | 0.92% | 1.0%(-0.107)#182 | 1.2%(-0.259)#8,387 |
| 39. | 55437 | 0.92% | 1.0%(-0.112)#186 | 1.2%(-0.265)#8,435 |
| 40. | 55412 | 0.79% | 1.0%(-0.239)#206 | 1.2%(-0.392)#9,529 |
| 41. | 55448 | 0.78% | 1.0%(-0.253)#210 | 1.2%(-0.405)#9,656 |
| 42. | 55432 | 0.78% | 1.0%(-0.253)#211 | 1.2%(-0.406)#9,661 |
| 43. | 55414 | 0.77% | 1.0%(-0.261)#218 | 1.2%(-0.414)#9,739 |
| 44. | 55449 | 0.76% | 1.0%(-0.269)#222 | 1.2%(-0.421)#9,796 |
| 45. | 55434 | 0.72% | 1.0%(-0.315)#236 | 1.2%(-0.468)#10,244 |
| 46. | 55420 | 0.54% | 1.0%(-0.491)#293 | 1.2%(-0.644)#12,153 |
| 47. | 55444 | 0.51% | 1.0%(-0.524)#312 | 1.2%(-0.677)#12,534 |
| 48. | 55430 | 0.46% | 1.0%(-0.574)#336 | 1.2%(-0.727)#13,178 |
| 49. | 55429 | 0.38% | 1.0%(-0.654)#373 | 1.2%(-0.807)#14,117 |
| 50. | 55433 | 0.27% | 1.0%(-0.765)#433 | 1.2%(-0.918)#15,443 |
1
Common Questions
What are the Top 10 Zip Codes with the Highest Percentage of Population Employed in Legal Services & Support in Minneapolis, MN?
Top 10 Zip Codes with the Highest Percentage of Population Employed in Legal Services & Support in Minneapolis, MN are:
What zip code has the Highest Percentage of Population Employed in Legal Services & Support in Minneapolis, MN?
55424 has the Highest Percentage of Population Employed in Legal Services & Support in Minneapolis, MN with 8.2%.
What is the Percentage of Population Employed in Legal Services & Support in Minneapolis, MN?
Percentage of Population Employed in Legal Services & Support in Minneapolis is 2.1%.
What is the Percentage of Population Employed in Legal Services & Support in Minnesota?
Percentage of Population Employed in Legal Services & Support in Minnesota is 1.0%.
What is the Percentage of Population Employed in Legal Services & Support in the United States?
Percentage of Population Employed in Legal Services & Support in the United States is 1.2%.