Zip Codes with the Highest Percentage of Population Employed in Health Diagnosing & Treating in Burnsville, MN
RELATED REPORTS & OPTIONS
Health Diagnosing & Treating
Burnsville
Compare Zip Codes
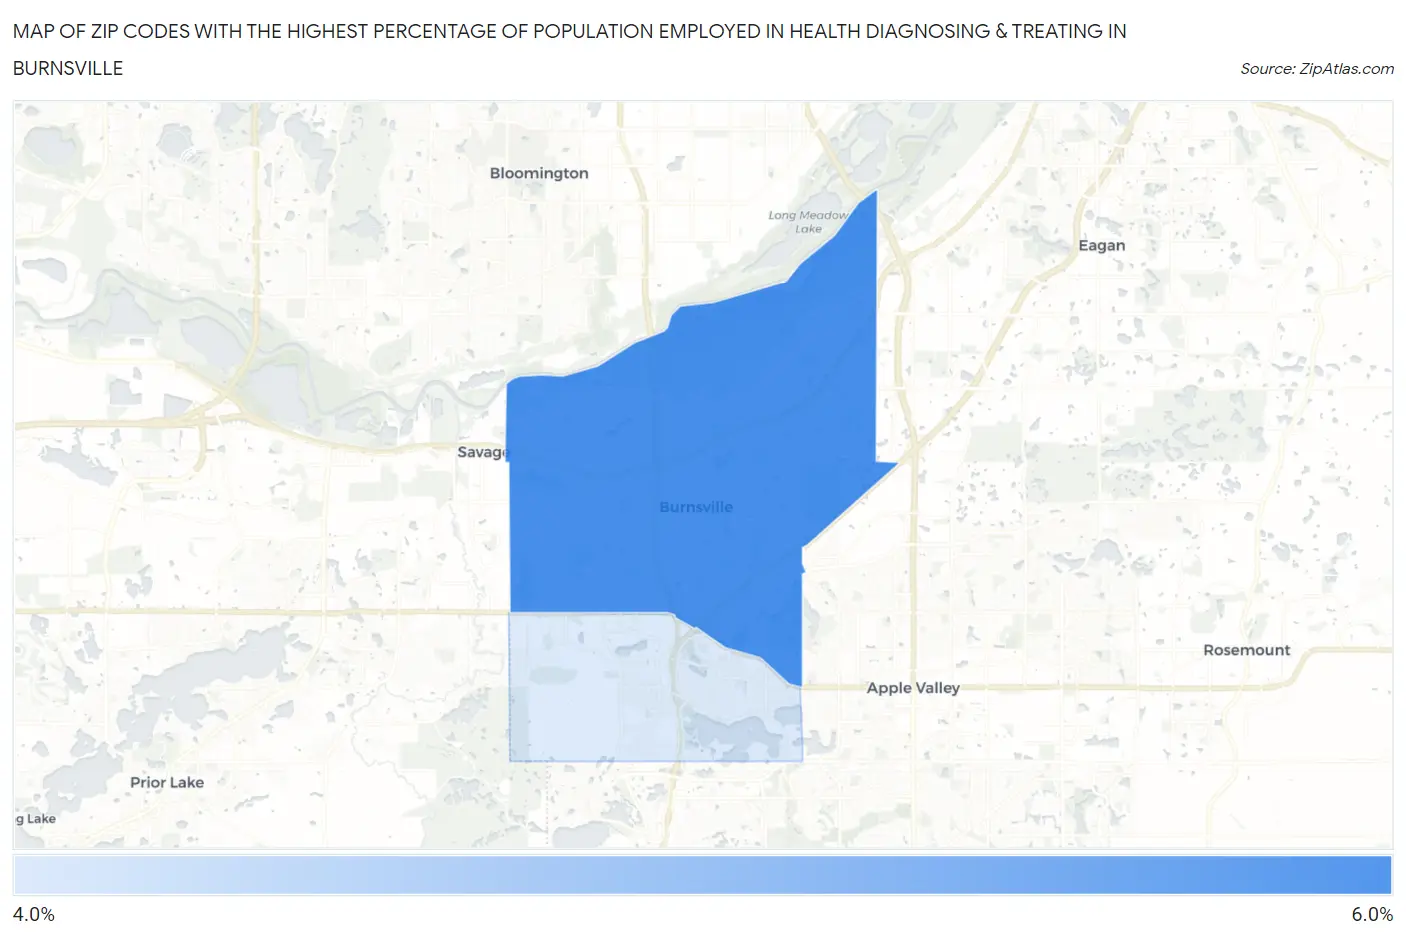
Map of Zip Codes with the Highest Percentage of Population Employed in Health Diagnosing & Treating in Burnsville
0.0%
6.0%
Zip Codes with the Highest Percentage of Population Employed in Health Diagnosing & Treating in Burnsville, MN
| Zip Code | % Employed | vs State | vs National | |
| 1. | 55337 | 5.2% | 6.8%(-1.52)#516 | 6.2%(-1.00)#16,787 |
| 2. | 55306 | 4.8% | 6.8%(-1.97)#574 | 6.2%(-1.46)#18,549 |
1
Common Questions
What are the Top Zip Codes with the Highest Percentage of Population Employed in Health Diagnosing & Treating in Burnsville, MN?
Top Zip Codes with the Highest Percentage of Population Employed in Health Diagnosing & Treating in Burnsville, MN are:
What zip code has the Highest Percentage of Population Employed in Health Diagnosing & Treating in Burnsville, MN?
55337 has the Highest Percentage of Population Employed in Health Diagnosing & Treating in Burnsville, MN with 5.2%.
What is the Percentage of Population Employed in Health Diagnosing & Treating in Burnsville, MN?
Percentage of Population Employed in Health Diagnosing & Treating in Burnsville is 5.1%.
What is the Percentage of Population Employed in Health Diagnosing & Treating in Minnesota?
Percentage of Population Employed in Health Diagnosing & Treating in Minnesota is 6.8%.
What is the Percentage of Population Employed in Health Diagnosing & Treating in the United States?
Percentage of Population Employed in Health Diagnosing & Treating in the United States is 6.2%.