Zip Codes with the Highest Percentage of Scotch-Irish Population in Detroit, MI

RELATED REPORTS & OPTIONS

Scotch-Irish
Population
Families and Households
Female Fertility
Female Fertility (Unmarried)
Race (Community Size)
Race (Percentage)
Ancestry (Community Size)
AfricanAlbanianAmericanApacheArabArgentineanArmenianAssyrian / Chaldean / SyriacAustralianAustrianBahamianBangladeshiBarbadianBelgianBelizeanBermudanBhutaneseBlackfeetBrazilianBritishBritish West IndianBurmeseCanadianCentral AmericanCentral American IndianCherokeeChippewaChoctawColombianCosta RicanCreekCroatianCubanCzechCzechoslovakianDanishDominicanDutchEastern EuropeanEcuadorianEgyptianEnglishEthiopianEuropeanFilipinoFinnishFrenchFrench American IndianFrench CanadianGermanGhanaianGreekGuamanian / ChamorroGuatemalanHaitianHonduranHungarianIndian (Asian)IndonesianIranianIraqiIrishIroquoisIsraeliItalianJamaicanJapaneseJordanianKoreanLebaneseLiberianLithuanianLumbeeMacedonianMalteseMexicanMexican American IndianMoroccanNative HawaiianNavajoNew ZealanderNicaraguanNigerianNorthern EuropeanNorwegianOttawaPakistaniPalestinianPanamanianPennsylvania GermanPeruvianPolishPortuguesePotawatomiPuerto RicanRomanianRussianSalvadoranSamoanScandinavianScotch-IrishScottishSenegaleseSerbianSlavicSlovakSloveneSouth AfricanSouth AmericanSouth American IndianSpaniardSpanishSri LankanSubsaharan AfricanSudaneseSwedishSwissSyrianThaiTrinidadian and TobagonianTurkishUkrainianVenezuelanVietnameseWelshWest IndianYugoslavian
Ancestry (Percentage)
AfricanAlbanianAmericanApacheArabArgentineanArmenianAssyrian / Chaldean / SyriacAustralianAustrianBahamianBangladeshiBarbadianBelgianBelizeanBermudanBhutaneseBlackfeetBrazilianBritishBritish West IndianBurmeseCanadianCentral AmericanCentral American IndianCherokeeChippewaChoctawColombianCosta RicanCreekCroatianCubanCzechCzechoslovakianDanishDominicanDutchEastern EuropeanEcuadorianEgyptianEnglishEthiopianEuropeanFilipinoFinnishFrenchFrench American IndianFrench CanadianGermanGhanaianGreekGuamanian / ChamorroGuatemalanHaitianHonduranHungarianIndian (Asian)IndonesianIranianIraqiIrishIroquoisIsraeliItalianJamaicanJapaneseJordanianKoreanLebaneseLiberianLithuanianLumbeeMacedonianMalteseMexicanMexican American IndianMoroccanNative HawaiianNavajoNew ZealanderNicaraguanNigerianNorthern EuropeanNorwegianOttawaPakistaniPalestinianPanamanianPennsylvania GermanPeruvianPolishPortuguesePotawatomiPuerto RicanRomanianRussianSalvadoranSamoanScandinavianScotch-IrishScottishSenegaleseSerbianSlavicSlovakSloveneSouth AfricanSouth AmericanSouth American IndianSpaniardSpanishSri LankanSubsaharan AfricanSudaneseSwedishSwissSyrianThaiTrinidadian and TobagonianTurkishUkrainianVenezuelanVietnameseWelshWest IndianYugoslavian
Immigrant Origin (Total)
Immigrant Origin (Percentage)
Income
Income (Families)
Income (Households)
Poverty
Poverty (Families)
Unemployment
Employment Occupations
Employment Industries
Employer Class
Commute Time
Commute Means
School Enrollment
Education by Degree Field
Occupancy
Finances
Physical Characteristics
Detroit
Compare Zip Codes
Comparison Subject

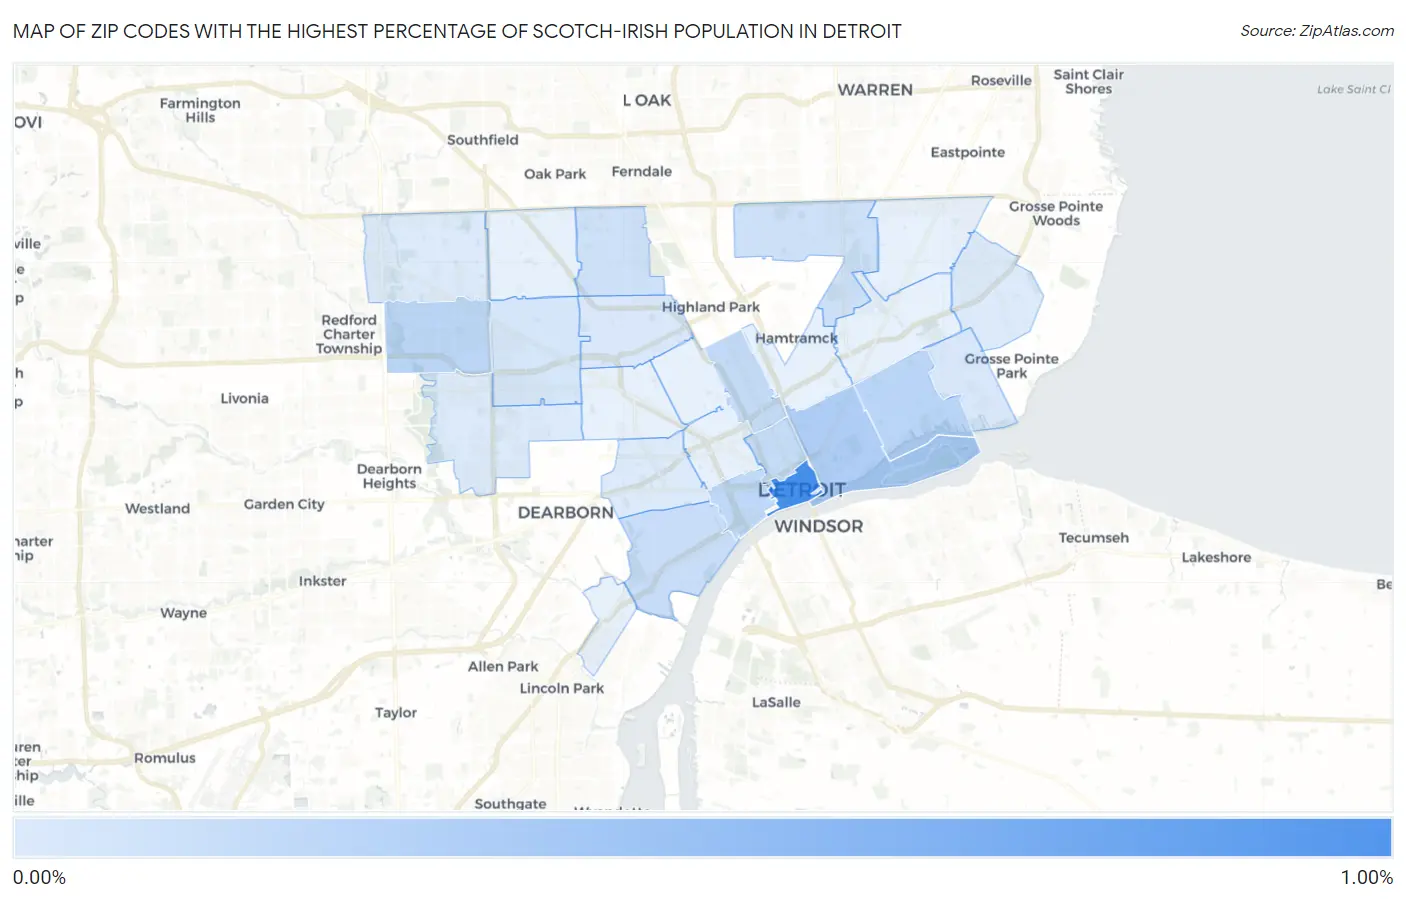
Map of Zip Codes with the Highest Percentage of Scotch-Irish Population in Detroit

0.00%
1.00%
Zip Codes with the Highest Percentage of Scotch-Irish Population in Detroit Map

Zip Codes with the Highest Percentage of Scotch-Irish Population in Detroit, MI

Zip Code Scotch-Irish vs State vs National
1.482260.81%0.65%(+0.161)#2840.82%(-0.009)#11,952
2.482070.26%0.65%(-0.390)#7030.82%(-0.560)#20,454
3.482140.20%0.65%(-0.447)#7460.82%(-0.617)#21,433
4.482230.19%0.65%(-0.462)#7590.82%(-0.631)#21,689
5.482160.17%0.65%(-0.474)#7660.82%(-0.644)#21,883
6.482020.16%0.65%(-0.491)#7750.82%(-0.661)#22,179
7.482010.14%0.65%(-0.508)#7810.82%(-0.678)#22,436
8.482090.13%0.65%(-0.518)#7910.82%(-0.688)#22,590
9.482340.093%0.65%(-0.555)#8070.82%(-0.725)#23,140
10.482210.089%0.65%(-0.559)#8090.82%(-0.729)#23,190
11.482270.059%0.65%(-0.589)#8170.82%(-0.759)#23,558
12.482150.045%0.65%(-0.603)#8200.82%(-0.772)#23,703
13.482380.033%0.65%(-0.615)#8220.82%(-0.785)#23,816
14.482240.024%0.65%(-0.624)#8240.82%(-0.794)#23,888
15.482100.023%0.65%(-0.625)#8250.82%(-0.795)#23,893
16.482190.020%0.65%(-0.628)#8270.82%(-0.798)#23,911
17.482280.020%0.65%(-0.628)#8280.82%(-0.798)#23,912

Common Questions

What are the Top 10 Zip Codes with the Highest Percentage of Scotch-Irish Population in Detroit, MI?
Top 10 Zip Codes with the Highest Percentage of Scotch-Irish Population in Detroit, MI are:
#1
0.81%
#2
0.26%
#3
0.20%
#4
0.19%
#5
0.17%
#6
0.16%
#7
0.14%
#8
0.13%
#9
0.093%
#10
0.089%
What zip code has the Highest Percentage of Scotch-Irish Population in Detroit, MI?
48226 has the Highest Percentage of Scotch-Irish Population in Detroit, MI with 0.81%.
What is the Percentage of Scotch-Irish Population in Detroit, MI?
Percentage of Scotch-Irish Population in Detroit is 0.084%.
What is the Percentage of Scotch-Irish Population in Michigan?
Percentage of Scotch-Irish Population in Michigan is 0.65%.
What is the Percentage of Scotch-Irish Population in the United States?
Percentage of Scotch-Irish Population in the United States is 0.82%.