Zip Codes with the Highest Percentage of Population Employed in Architecture & Engineering in Bay City, MI
RELATED REPORTS & OPTIONS
Architecture & Engineering
Bay City
Compare Zip Codes
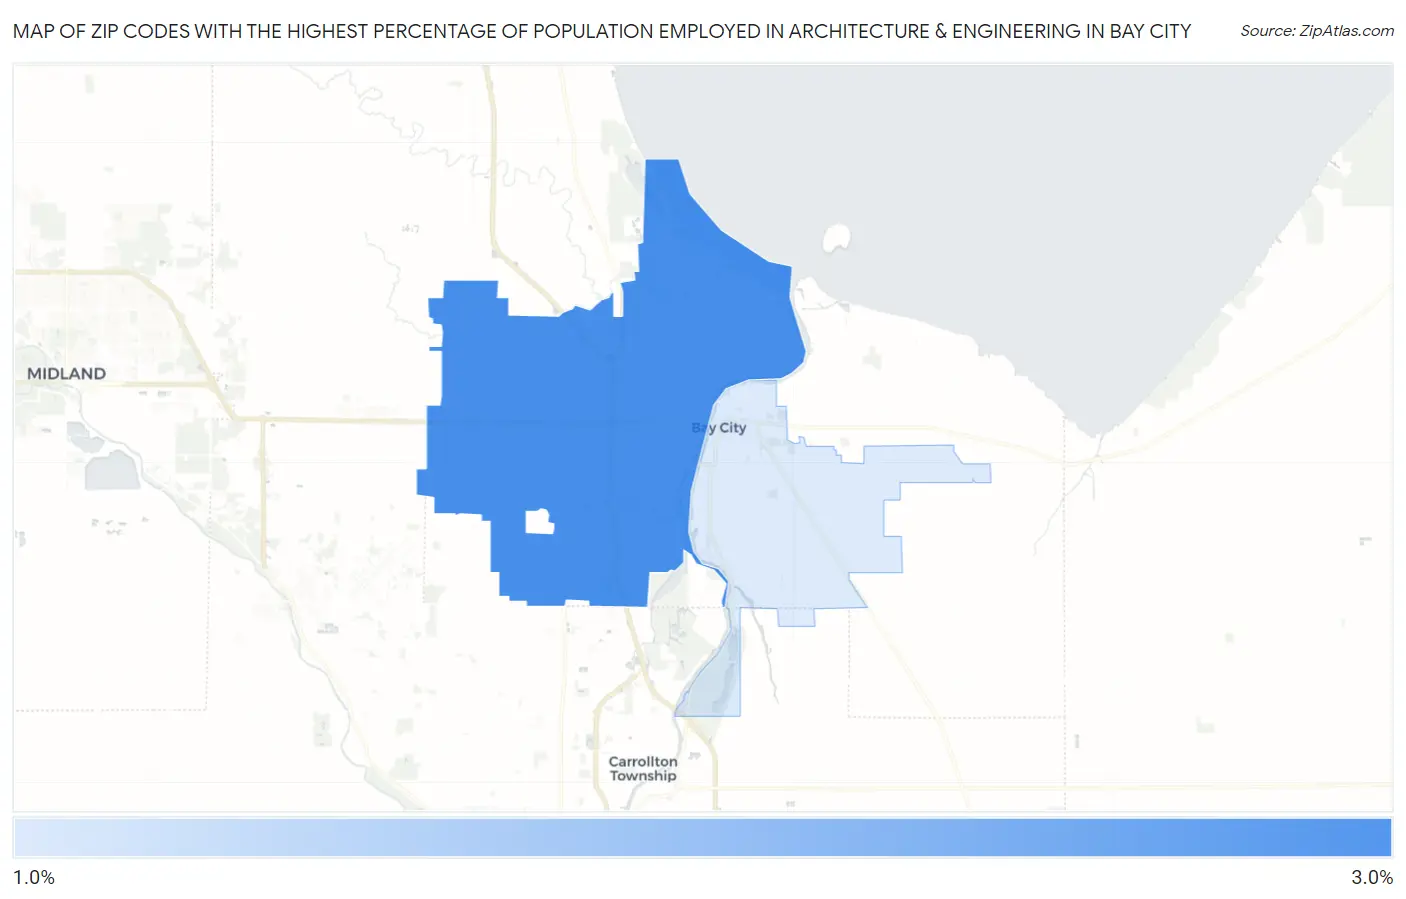
Map of Zip Codes with the Highest Percentage of Population Employed in Architecture & Engineering in Bay City
0.0%
3.0%
Zip Codes with the Highest Percentage of Population Employed in Architecture & Engineering in Bay City, MI
| Zip Code | % Employed | vs State | vs National | |
| 1. | 48706 | 2.6% | 3.4%(-0.816)#349 | 2.1%(+0.402)#6,781 |
| 2. | 48708 | 1.8% | 3.4%(-1.58)#498 | 2.1%(-0.358)#10,875 |
1
Common Questions
What are the Top Zip Codes with the Highest Percentage of Population Employed in Architecture & Engineering in Bay City, MI?
Top Zip Codes with the Highest Percentage of Population Employed in Architecture & Engineering in Bay City, MI are:
What zip code has the Highest Percentage of Population Employed in Architecture & Engineering in Bay City, MI?
48706 has the Highest Percentage of Population Employed in Architecture & Engineering in Bay City, MI with 2.6%.
What is the Percentage of Population Employed in Architecture & Engineering in Bay City, MI?
Percentage of Population Employed in Architecture & Engineering in Bay City is 1.3%.
What is the Percentage of Population Employed in Architecture & Engineering in Michigan?
Percentage of Population Employed in Architecture & Engineering in Michigan is 3.4%.
What is the Percentage of Population Employed in Architecture & Engineering in the United States?
Percentage of Population Employed in Architecture & Engineering in the United States is 2.1%.