Zip Codes with the Highest Percentage of Population Employed in Architecture & Engineering in Oxford, MI
RELATED REPORTS & OPTIONS
Architecture & Engineering
Oxford
Compare Zip Codes
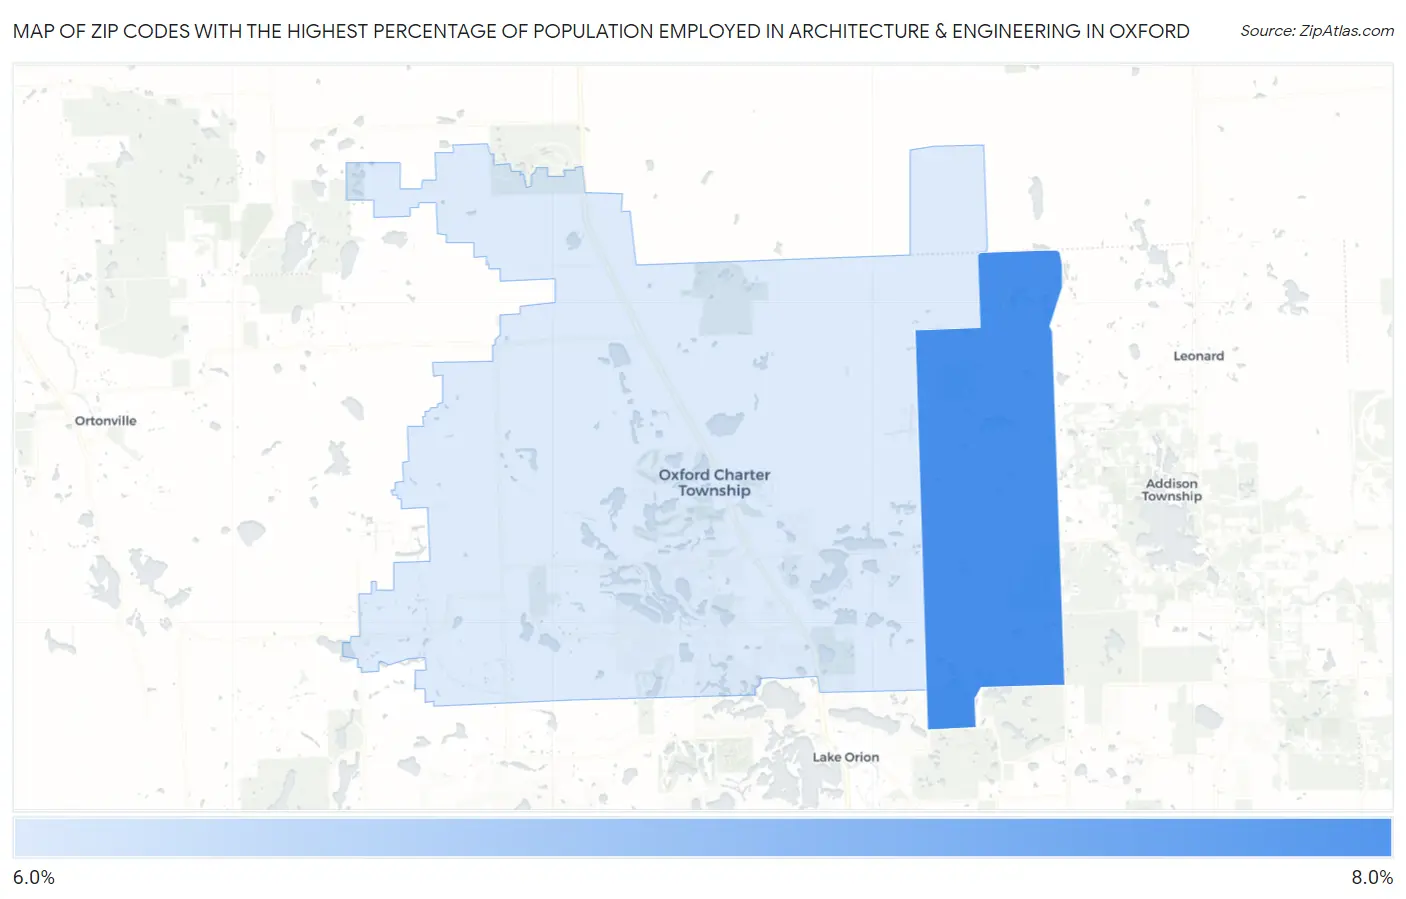
Map of Zip Codes with the Highest Percentage of Population Employed in Architecture & Engineering in Oxford
0.0%
8.0%
Zip Codes with the Highest Percentage of Population Employed in Architecture & Engineering in Oxford, MI
| Zip Code | % Employed | vs State | vs National | |
| 1. | 48370 | 7.4% | 3.4%(+4.08)#40 | 2.1%(+5.30)#661 |
| 2. | 48371 | 6.6% | 3.4%(+3.19)#55 | 2.1%(+4.41)#865 |
1
Common Questions
What are the Top Zip Codes with the Highest Percentage of Population Employed in Architecture & Engineering in Oxford, MI?
Top Zip Codes with the Highest Percentage of Population Employed in Architecture & Engineering in Oxford, MI are:
What zip code has the Highest Percentage of Population Employed in Architecture & Engineering in Oxford, MI?
48370 has the Highest Percentage of Population Employed in Architecture & Engineering in Oxford, MI with 7.4%.
What is the Percentage of Population Employed in Architecture & Engineering in Oxford, MI?
Percentage of Population Employed in Architecture & Engineering in Oxford is 6.4%.
What is the Percentage of Population Employed in Architecture & Engineering in Michigan?
Percentage of Population Employed in Architecture & Engineering in Michigan is 3.4%.
What is the Percentage of Population Employed in Architecture & Engineering in the United States?
Percentage of Population Employed in Architecture & Engineering in the United States is 2.1%.