Zip Codes with the Highest Percentage of Population Employed in Accommodation & Food Services in Ellicott City, MD
RELATED REPORTS & OPTIONS
Accommodation & Food Services
Ellicott City
Compare Zip Codes
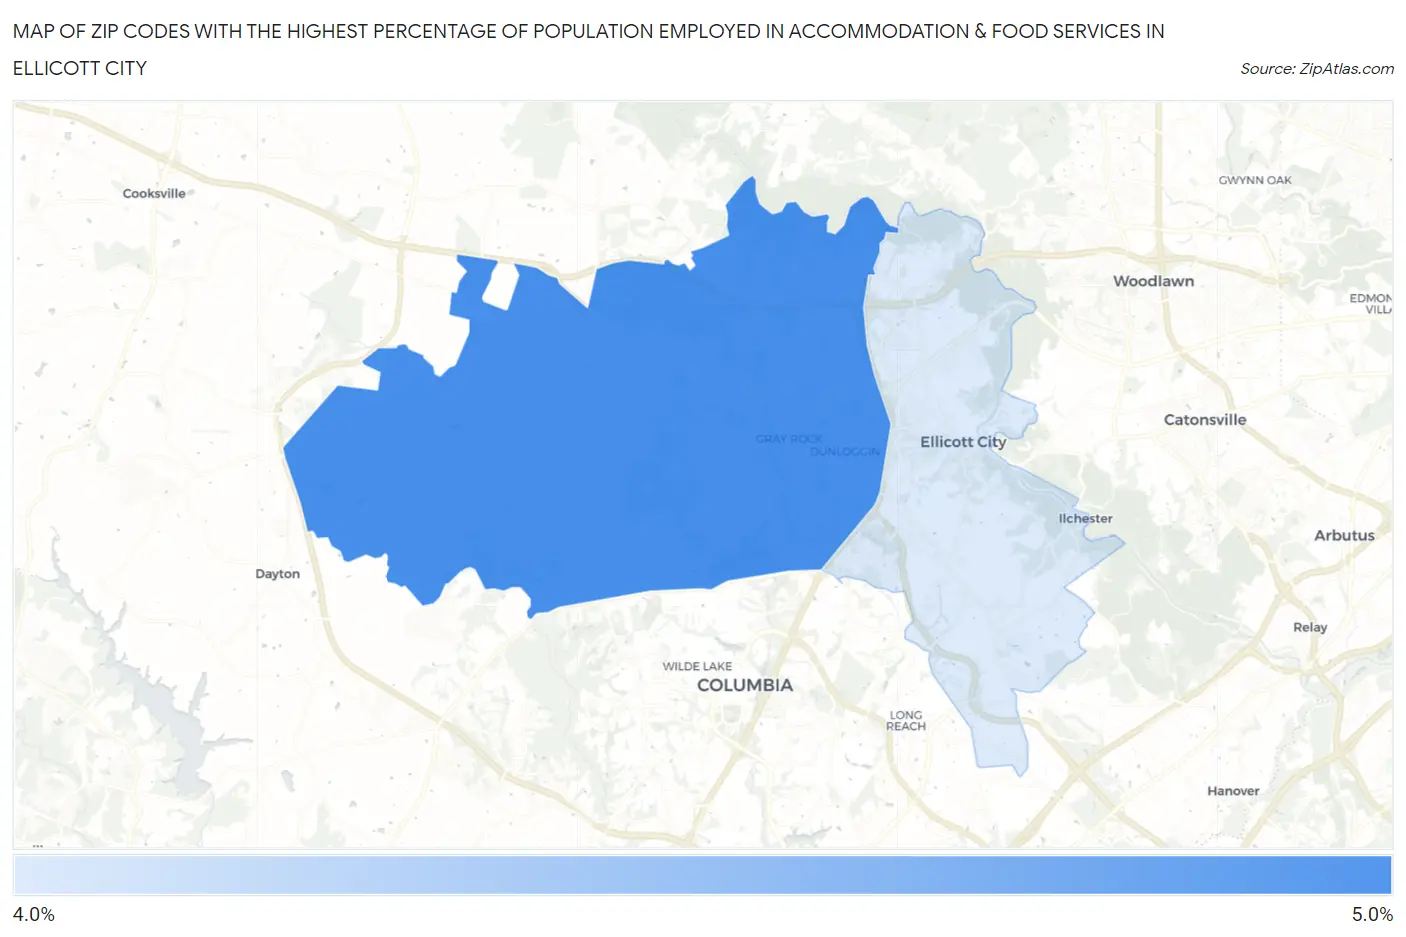
Map of Zip Codes with the Highest Percentage of Population Employed in Accommodation & Food Services in Ellicott City
0.0%
5.0%
Zip Codes with the Highest Percentage of Population Employed in Accommodation & Food Services in Ellicott City, MD
| Zip Code | % Employed | vs State | vs National | |
| 1. | 21042 | 4.5% | 5.8%(-1.31)#244 | 6.9%(-2.35)#18,378 |
| 2. | 21043 | 4.4% | 5.8%(-1.41)#249 | 6.9%(-2.44)#18,715 |
1
Common Questions
What are the Top Zip Codes with the Highest Percentage of Population Employed in Accommodation & Food Services in Ellicott City, MD?
Top Zip Codes with the Highest Percentage of Population Employed in Accommodation & Food Services in Ellicott City, MD are:
What zip code has the Highest Percentage of Population Employed in Accommodation & Food Services in Ellicott City, MD?
21042 has the Highest Percentage of Population Employed in Accommodation & Food Services in Ellicott City, MD with 4.5%.
What is the Percentage of Population Employed in Accommodation & Food Services in Ellicott City, MD?
Percentage of Population Employed in Accommodation & Food Services in Ellicott City is 4.5%.
What is the Percentage of Population Employed in Accommodation & Food Services in Maryland?
Percentage of Population Employed in Accommodation & Food Services in Maryland is 5.8%.
What is the Percentage of Population Employed in Accommodation & Food Services in the United States?
Percentage of Population Employed in Accommodation & Food Services in the United States is 6.9%.