Zip Codes with the Highest Percentage of Population Employed in Accommodation & Food Services in Hyattsville, MD
RELATED REPORTS & OPTIONS
Accommodation & Food Services
Hyattsville
Compare Zip Codes
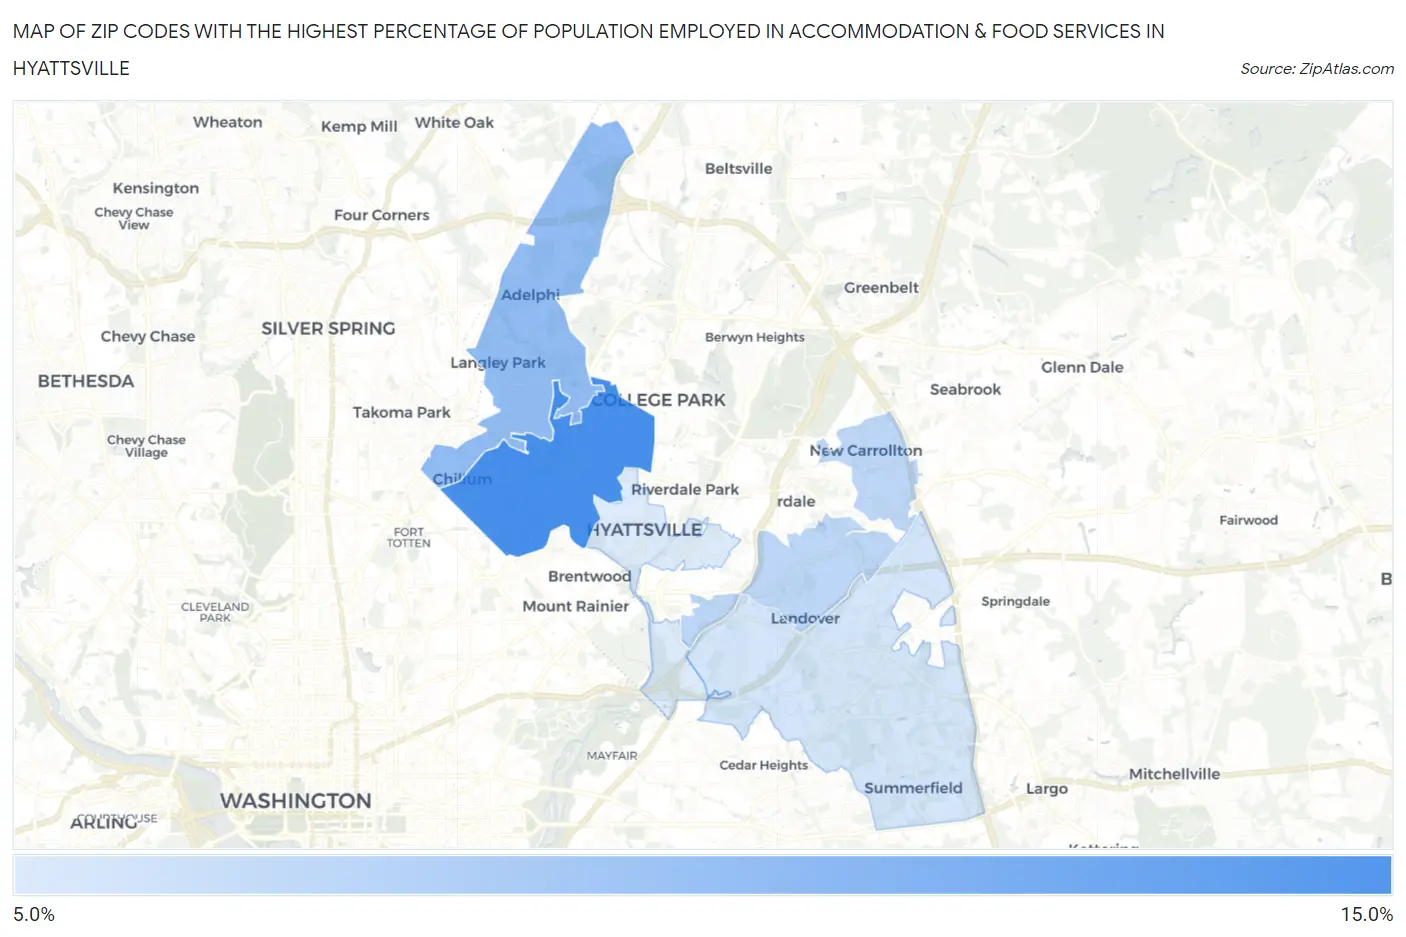
Map of Zip Codes with the Highest Percentage of Population Employed in Accommodation & Food Services in Hyattsville
0.0%
15.0%
Zip Codes with the Highest Percentage of Population Employed in Accommodation & Food Services in Hyattsville, MD
| Zip Code | % Employed | vs State | vs National | |
| 1. | 20782 | 11.0% | 5.8%(+5.20)#33 | 6.9%(+4.17)#3,514 |
| 2. | 20783 | 9.1% | 5.8%(+3.24)#52 | 6.9%(+2.20)#5,831 |
| 3. | 20784 | 8.0% | 5.8%(+2.14)#72 | 6.9%(+1.11)#7,844 |
| 4. | 20785 | 7.4% | 5.8%(+1.56)#88 | 6.9%(+0.529)#9,221 |
| 5. | 20781 | 7.2% | 5.8%(+1.30)#98 | 6.9%(+0.269)#9,919 |
1
Common Questions
What are the Top 3 Zip Codes with the Highest Percentage of Population Employed in Accommodation & Food Services in Hyattsville, MD?
Top 3 Zip Codes with the Highest Percentage of Population Employed in Accommodation & Food Services in Hyattsville, MD are:
What zip code has the Highest Percentage of Population Employed in Accommodation & Food Services in Hyattsville, MD?
20782 has the Highest Percentage of Population Employed in Accommodation & Food Services in Hyattsville, MD with 11.0%.
What is the Percentage of Population Employed in Accommodation & Food Services in Hyattsville, MD?
Percentage of Population Employed in Accommodation & Food Services in Hyattsville is 8.0%.
What is the Percentage of Population Employed in Accommodation & Food Services in Maryland?
Percentage of Population Employed in Accommodation & Food Services in Maryland is 5.8%.
What is the Percentage of Population Employed in Accommodation & Food Services in the United States?
Percentage of Population Employed in Accommodation & Food Services in the United States is 6.9%.