Zip Codes with the Highest Percentage of Households Without a Vehicle in Baltimore, MD
RELATED REPORTS & OPTIONS
Households without a Cars
Baltimore
Compare Zip Codes
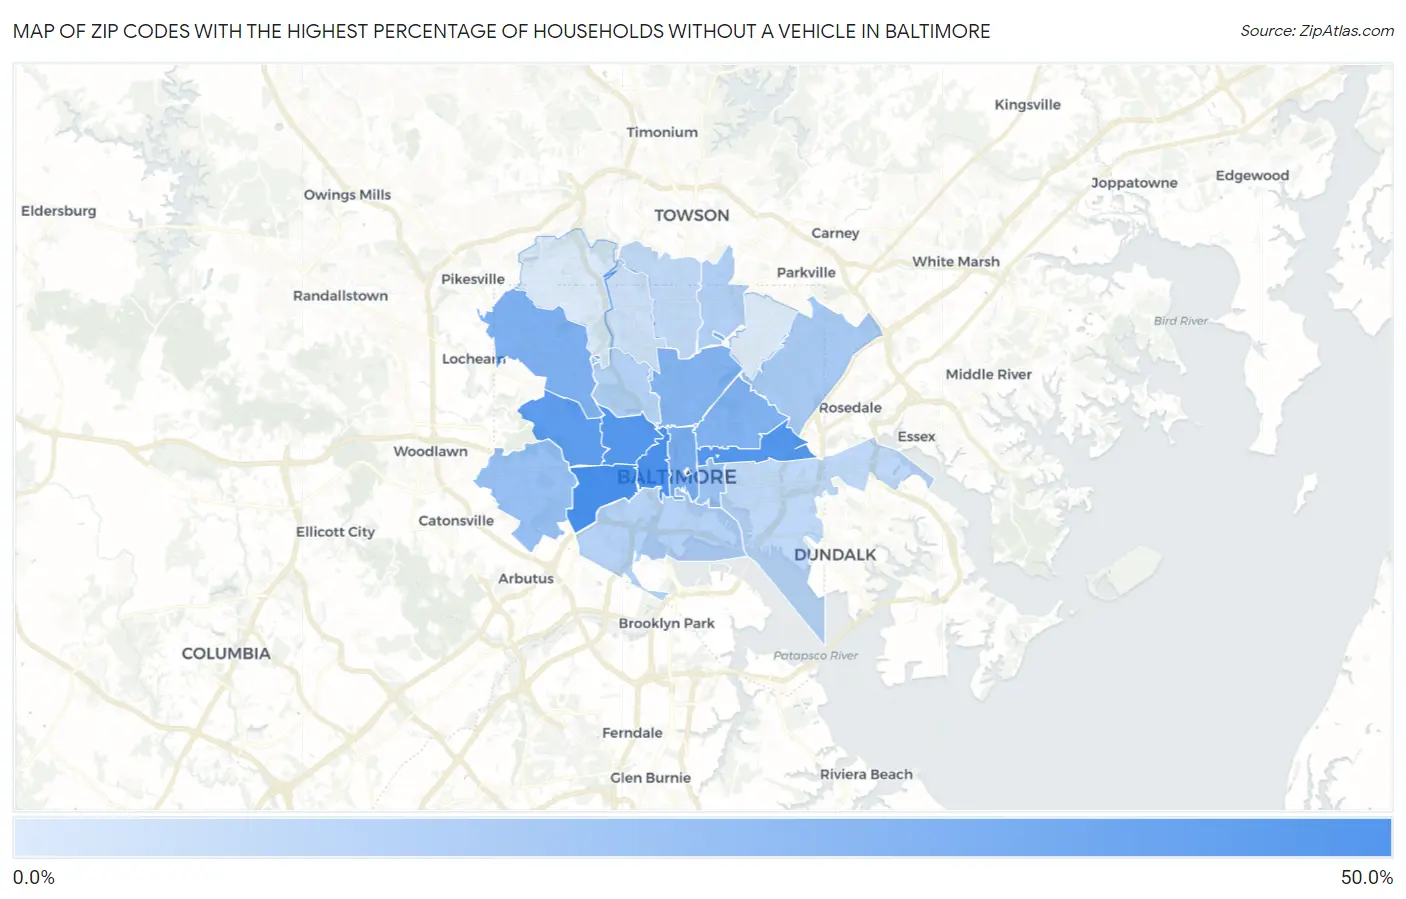
Map of Zip Codes with the Highest Percentage of Households Without a Vehicle in Baltimore
0.0%
50.0%
Zip Codes with the Highest Percentage of Households Without a Vehicle in Baltimore, MD
| Zip Code | Housholds Without a Car | vs State | vs National | |
| 1. | 21223 | 47.2% | 8.7%(+38.5)#2 | 8.3%(+38.9)#376 |
| 2. | 21201 | 46.5% | 8.7%(+37.8)#3 | 8.3%(+38.2)#386 |
| 3. | 21205 | 43.6% | 8.7%(+34.9)#5 | 8.3%(+35.3)#434 |
| 4. | 21217 | 42.9% | 8.7%(+34.2)#6 | 8.3%(+34.6)#451 |
| 5. | 21216 | 40.1% | 8.7%(+31.4)#7 | 8.3%(+31.8)#510 |
| 6. | 21202 | 32.4% | 8.7%(+23.7)#9 | 8.3%(+24.1)#714 |
| 7. | 21215 | 30.8% | 8.7%(+22.1)#10 | 8.3%(+22.5)#771 |
| 8. | 21213 | 29.9% | 8.7%(+21.2)#11 | 8.3%(+21.6)#806 |
| 9. | 21218 | 29.5% | 8.7%(+20.8)#12 | 8.3%(+21.2)#823 |
| 10. | 21229 | 23.2% | 8.7%(+14.5)#14 | 8.3%(+14.9)#1,193 |
| 11. | 21231 | 22.5% | 8.7%(+13.8)#16 | 8.3%(+14.2)#1,261 |
| 12. | 21206 | 19.2% | 8.7%(+10.5)#20 | 8.3%(+10.9)#1,603 |
| 13. | 21239 | 16.0% | 8.7%(+7.30)#25 | 8.3%(+7.70)#2,146 |
| 14. | 21211 | 15.9% | 8.7%(+7.20)#26 | 8.3%(+7.60)#2,178 |
| 15. | 21230 | 15.4% | 8.7%(+6.70)#28 | 8.3%(+7.10)#2,271 |
| 16. | 21224 | 13.6% | 8.7%(+4.90)#37 | 8.3%(+5.30)#2,838 |
| 17. | 21212 | 12.6% | 8.7%(+3.90)#51 | 8.3%(+4.30)#3,269 |
| 18. | 21210 | 10.2% | 8.7%(+1.50)#74 | 8.3%(+1.90)#4,709 |
| 19. | 21209 | 6.2% | 8.7%(-2.50)#131 | 8.3%(-2.10)#9,997 |
| 20. | 21214 | 6.2% | 8.7%(-2.50)#132 | 8.3%(-2.10)#10,026 |
1
Common Questions
What are the Top 10 Zip Codes with the Highest Percentage of Households Without a Vehicle in Baltimore, MD?
Top 10 Zip Codes with the Highest Percentage of Households Without a Vehicle in Baltimore, MD are:
What zip code has the Highest Percentage of Households Without a Vehicle in Baltimore, MD?
21223 has the Highest Percentage of Households Without a Vehicle in Baltimore, MD with 47.2%.
What is the Percentage of Households Without a Vehicle in Baltimore, MD?
Percentage of Households Without a Vehicle in Baltimore is 26.5%.
What is the Percentage of Households Without a Vehicle in Maryland?
Percentage of Households Without a Vehicle in Maryland is 8.7%.
What is the Percentage of Households Without a Vehicle in the United States?
Percentage of Households Without a Vehicle in the United States is 8.3%.