Zip Codes with the Highest Percentage of Population Employed in Legal Services & Support in Baltimore, MD
RELATED REPORTS & OPTIONS
Legal Services & Support
Baltimore
Compare Zip Codes
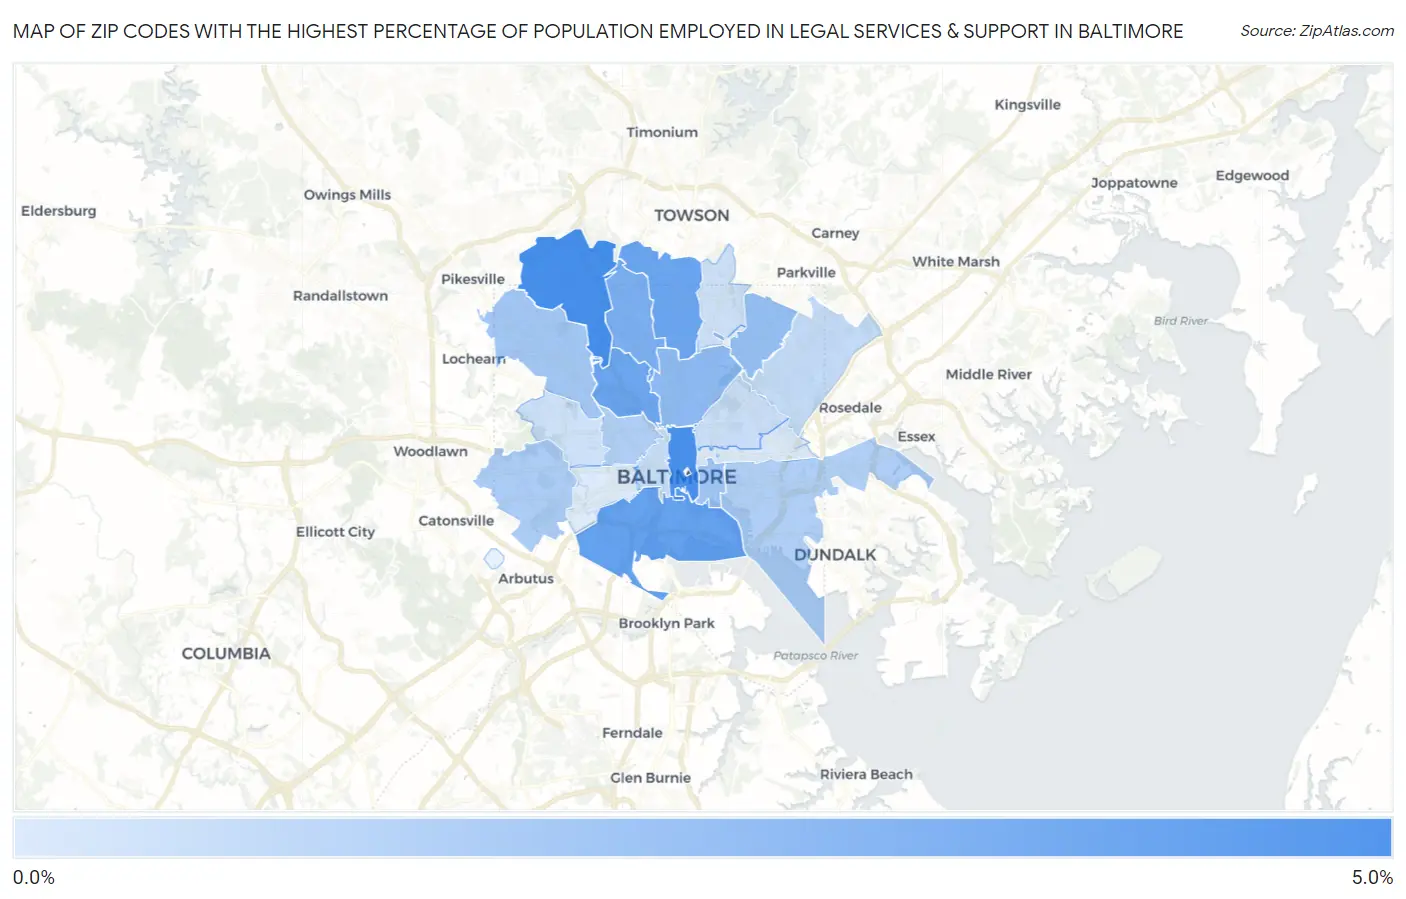
Map of Zip Codes with the Highest Percentage of Population Employed in Legal Services & Support in Baltimore
0.0%
5.0%
Zip Codes with the Highest Percentage of Population Employed in Legal Services & Support in Baltimore, MD
| Zip Code | % Employed | vs State | vs National | |
| 1. | 21209 | 4.4% | 1.8%(+2.58)#29 | 1.2%(+3.17)#959 |
| 2. | 21202 | 4.3% | 1.8%(+2.54)#31 | 1.2%(+3.13)#971 |
| 3. | 21230 | 3.5% | 1.8%(+1.74)#42 | 1.2%(+2.33)#1,422 |
| 4. | 21212 | 3.3% | 1.8%(+1.55)#45 | 1.2%(+2.14)#1,559 |
| 5. | 21211 | 3.2% | 1.8%(+1.45)#49 | 1.2%(+2.04)#1,625 |
| 6. | 21210 | 2.9% | 1.8%(+1.12)#60 | 1.2%(+1.71)#1,982 |
| 7. | 21218 | 2.4% | 1.8%(+0.595)#84 | 1.2%(+1.18)#2,724 |
| 8. | 21214 | 2.2% | 1.8%(+0.410)#93 | 1.2%(+1.000)#3,066 |
| 9. | 21231 | 1.8% | 1.8%(+0.050)#119 | 1.2%(+0.639)#3,935 |
| 10. | 21215 | 1.8% | 1.8%(+0.029)#121 | 1.2%(+0.619)#3,996 |
| 11. | 21229 | 1.5% | 1.8%(-0.259)#142 | 1.2%(+0.331)#4,986 |
| 12. | 21217 | 1.5% | 1.8%(-0.271)#145 | 1.2%(+0.318)#5,047 |
| 13. | 21224 | 1.4% | 1.8%(-0.369)#151 | 1.2%(+0.220)#5,451 |
| 14. | 21206 | 0.93% | 1.8%(-0.838)#205 | 1.2%(-0.249)#8,315 |
| 15. | 21201 | 0.87% | 1.8%(-0.901)#214 | 1.2%(-0.312)#8,848 |
| 16. | 21213 | 0.71% | 1.8%(-1.07)#238 | 1.2%(-0.477)#10,343 |
| 17. | 21239 | 0.60% | 1.8%(-1.18)#249 | 1.2%(-0.587)#11,499 |
| 18. | 21216 | 0.58% | 1.8%(-1.19)#254 | 1.2%(-0.606)#11,713 |
| 19. | 21205 | 0.28% | 1.8%(-1.49)#290 | 1.2%(-0.901)#15,216 |
| 20. | 21223 | 0.22% | 1.8%(-1.55)#302 | 1.2%(-0.963)#15,974 |
1
Common Questions
What are the Top 10 Zip Codes with the Highest Percentage of Population Employed in Legal Services & Support in Baltimore, MD?
Top 10 Zip Codes with the Highest Percentage of Population Employed in Legal Services & Support in Baltimore, MD are:
What zip code has the Highest Percentage of Population Employed in Legal Services & Support in Baltimore, MD?
21209 has the Highest Percentage of Population Employed in Legal Services & Support in Baltimore, MD with 4.4%.
What is the Percentage of Population Employed in Legal Services & Support in Baltimore, MD?
Percentage of Population Employed in Legal Services & Support in Baltimore is 1.8%.
What is the Percentage of Population Employed in Legal Services & Support in Maryland?
Percentage of Population Employed in Legal Services & Support in Maryland is 1.8%.
What is the Percentage of Population Employed in Legal Services & Support in the United States?
Percentage of Population Employed in Legal Services & Support in the United States is 1.2%.